. 2007 Oct 1;204(10):2449-60.
doi: 10.1084/jem.20070657. Epub 2007 Sep 17.

Role of the T cell in the genesis of angiotensin II induced hypertension and vascular dysfunction

Affiliations

Role of the T cell in the genesis of angiotensin II induced hypertension and vascular dysfunction

Tomasz J Guzik et al. J Exp Med. .

Abstract

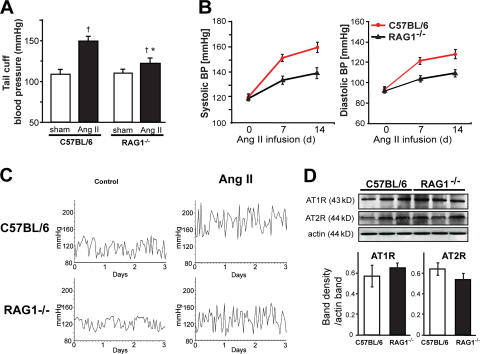
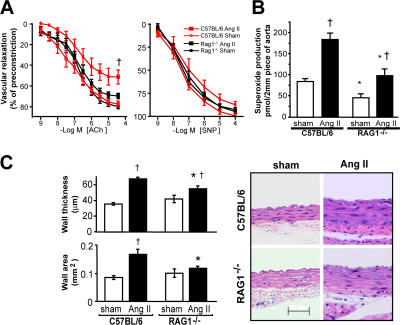
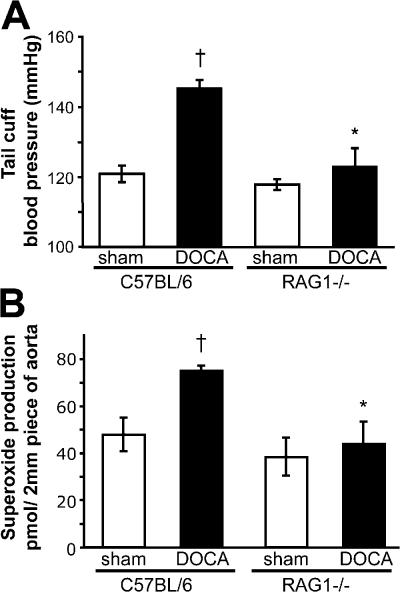
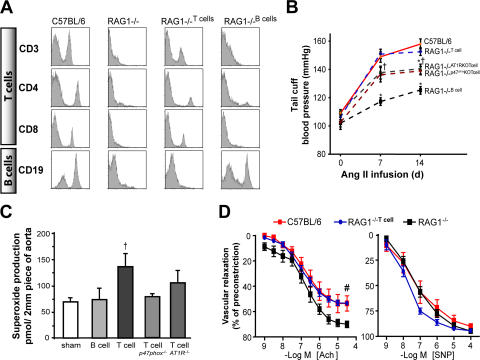
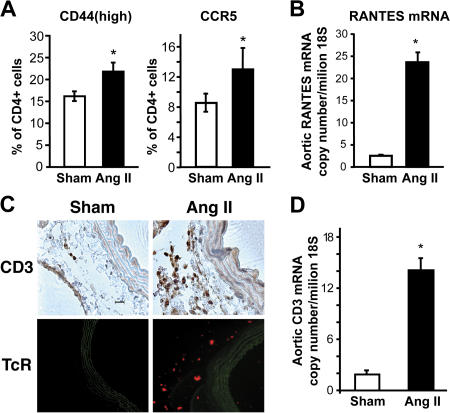
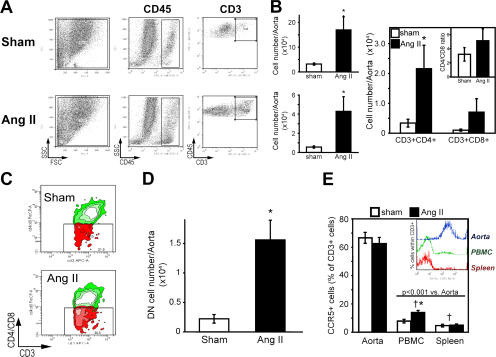
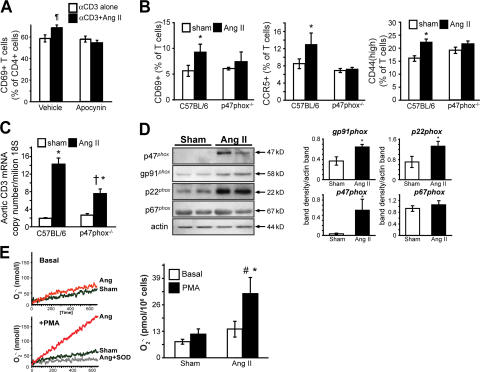
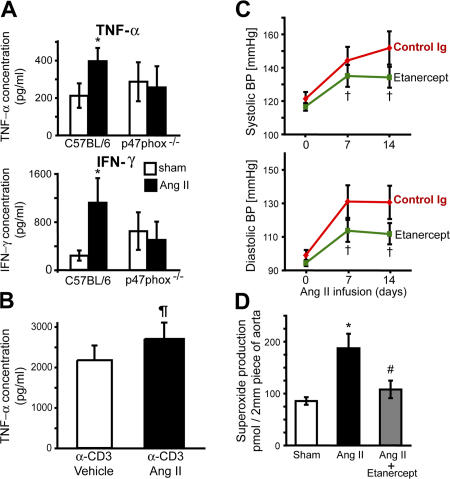
Hypertension promotes atherosclerosis and is a major source of morbidity and mortality. We show that mice lacking T and B cells (RAG-1-/- mice) have blunted hypertension and do not develop abnormalities of vascular function during angiotensin II infusion or desoxycorticosterone acetate (DOCA)-salt. Adoptive transfer of T, but not B, cells restored these abnormalities. Angiotensin II is known to stimulate reactive oxygen species production via the nicotinamide adenosine dinucleotide phosphate (NADPH) oxidase in several cells, including some immune cells. Accordingly, adoptive transfer of T cells lacking the angiotensin type I receptor or a functional NADPH oxidase resulted in blunted angiotensin II-dependent hypertension and decreased aortic superoxide production. Angiotensin II increased T cell markers of activation and tissue homing in wild-type, but not NADPH oxidase-deficient, mice. Angiotensin II markedly increased T cells in the perivascular adipose tissue (periadventitial fat) and, to a lesser extent the adventitia. These cells expressed high levels of CC chemokine receptor 5 and were commonly double negative (CD3+CD4-CD8-). This infiltration was associated with an increase in intercellular adhesion molecule-1 and RANTES in the aorta. Hypertension also increased T lymphocyte production of tumor necrosis factor (TNF) alpha, and treatment with the TNFalpha antagonist etanercept prevented the hypertension and increase in vascular superoxide caused by angiotensin II. These studies identify a previously undefined role for T cells in the genesis of hypertension and support a role of inflammation in the basis of this prevalent disease. T cells might represent a novel therapeutic target for the treatment of high blood pressure.


Figures

Figure 1.
Figure 1.
Role of lymphocytes in development of angiotensin II–dependent hypertension. C57BL/6 and RAG-1−/− mice were treated for 14 d with 490 ng/min/kg angiotensin II, which was administered subcutaneously via osmotic minipump. (A) Noninvasive blood pressure measurements obtained via the tail cuff method (n = 10 in each group). (B) Sample traces of telemetric systolic blood pressure recordings obtained in freely moving C57BL/6 and RAG1−/− mice showing the 3 d before angiotensin II pump implantation (control) and the last 3 d of angiotensin II infusion. (C) Mean values of invasive measurements of blood pressure at baseline and during angiotensin II infusion (n = 6–12). (D) Sample Western blots (top) and densitometric analysis (bottom; n = 4 in each group) for expression of AT1 and AT2 receptors in aortas of C57BL/6 and RAG-1−/− mice. *, P < 0.01 vs. C57BL/6; †, P < 0.05 vs. sham. Data are expressed as the means ± the SEM.
Figure 2.
Figure 2.
Role of lymphocytes in the development of vascular dysfunction and hypertrophy in angiotensin II–dependent hypertension. (A) Effect of angiotensin II–induced hypertension on endothelium-dependent vasodilatation to acetylcholine (Ach) in aortas of C57BL/6 (n = 6) and RAG-1−/− (n = 9) mice (left). Relaxations to sodium nitroprusside (SNP) were examined as a measure of nonendothelium-dependent vasodilatation (right). (B) Aortic superoxide levels measured by monitoring the oxidation of dihydroethidium to 2-hydroxyethidium using high pressure liquid chromatography after 14 d of angiotensin II infusion (n = 8–10). (C) Effect of angiotensin II–induced hypertension on aortic hypertrophy in C57BL/6 (n = 6 in each group) and RAG-1−/− (n = 6 in each group) mice measured as wall thickness (top left) and by total wall area determined by planimetry (bottom left) in hematoxylin-eosin–stained sections of thoracic aorta. Sample sections are shown on the right. *, P < 0.01 vs. C57BL/6; †, P < 0.05 vs. sham. Data are expressed as the means ± the SEM. Bar, 50 μm.
Figure 3.
Figure 3.
Role of lymphocytes in development of DOCA-salt–induced hypertension and vascular oxidative stress. C57BL/6 and RAG-1−/− mice were subjected to DOCA-salt hypertension for 40 d. (A) Noninvasive blood pressure measurements were obtained via the tail cuff method (n = 5–6) in DOCA-salt–induced hypertension and in sham-operated C57BL/6 (n = 5) and RAG1−/− (n = 6) mice. (B) Aortic superoxide levels measured by monitoring the oxidation of dihydroethidium to 2-hydroxyethidium using high pressure liquid chromatography after 40 d of DOCA-salt hypertension (n = 8–10). *, P < 0.01 vs. C57BL/6; †, P < 0.05 vs. sham. Data are expressed as the means ± the SEM.
Figure 4.
Figure 4.
Comparison of the role of B and T lymphocytes in modulation of blood pressure and vascular function in response to angiotensin II–mediated hypertension using adoptive transfer. RAG-1−/− mice received either no cells (saline; n = 4), B cells (n = 4), wild-type T cells (n = 10), or T cells from mice lacking AT1a receptors (n = 6) or from mice lacking p47phox NADPH oxidase subunit (n = 4). 3 wk after this, osmotic minipumps for angiotensin II infusion were surgically implanted. (A) Flow cytometric analysis of lymphocyte surface markers from C57BL/6 and RAG-1−/− mice at baseline and 3 wk after adoptive transfer of T and B lymphocytes. (B) Blood pressures at baseline and after angiotensin II infusion measured by tail cuff. (C) Aortic O2 ·− levels after angiotensin II infusion. (D) Endothelium-dependent vasodilatation to acetylcholine and sodium nitroprusside after angiotensin II infusion. *, P < 0.01 vs. C57BL/6; †, P < 0.01 vs. sham; #, P < 0.01 vs. RAG-1−/−. Data are expressed as the means ± the SEM.
Figure 5.
Figure 5.
T cell homing and vascular infiltration in response to angiotensin II–induced hypertension. (A) The percentage of circulating CD4+ lymphocytes expressing CCR5 and high levels of CD44, as determined by flow cytometric analysis (n = 10). (B) Aortic mRNA expression of the CCR5 ligand RANTES, as determined by real time PCR (n = 6). (C) Immunostaining of aortas from sham-treated and angiotensin II–infused C57BL/6 mice using anti-CD3 (top) and a fluorescent anti–TCR antibody (representative of n = 4–6 experiments). (D) Aortic CD3 (ε chain) mRNA determined by real-time PCR in sham-treated and angiotensin II–infused C57BL/6 (n = 6 in each group). *, P < 0.05 vs. sham. Data are expressed as the means ± the SEM. Bar, 20 μm.
Figure 6.
Figure 6.
Characteristics of T cells infiltrating the aorta in response to angiotensin II–induced hypertension. (A) Examples of flow cytometric analysis of collagenase-digested cell suspensions of sham- and angiotensin II–infused mouse aortas. Fluorescent staining was performed to detect CD45 (total leukocytes) and CD3 (T cells). (B) Absolute numbers of total leukocytes (CD45+, top left), total T cells (CD3+, bottom left), and CD4+ and CD8+ subclasses (right) in whole aortas from sham- (open bars) and angiotensin II–infused mice (filled bars; n = 9). Insert shows the alteration of CD4/CD8 index caused by angiotensin II infusion. (C) Sample flow cytometric analysis and (D) absolute numbers of total DN (CD3+CD4-CD8-) T cells in single-cell suspensions from aortas of sham-infused (n = 9) and angiotensin II–treated mice (n = 9). CD4+ and CD8+ cells were both labeled with PerCP, and CD3+ cells were labeled with APC. DN T cells were gated based on control experiments in which isotype antibody control (PerCP) was added instead of anti-CD4 and -CD8. (E) Percentage of CCR5+ T cells in the aorta, peripheral blood, and spleen of sham-treated (n = 5) and angiotensin II–infused mice (n = 5). Inset shows sample histograms of the CCR5 expression within the CD3+ gate. *, P < 0.05 vs. sham; †, P < 0.01 vs. aorta. Data are expressed as the means ± the SEM.
Figure 7.
Figure 7.
Role of the T lymphocyte NADPH oxidase in modulating T cell activation, tissue homing, and blood pressure in response to angiotensin II. (A) Effect of 100 nM angiotensin II on the early activation marker CD69 in cultured T cells exposed to anti-CD3 (n = 5). Parallel experiments were performed in the presence of the NADPH oxidase inhibitor apocynin (300 μM/liter; n = 4). (B) Role of the NADPH oxidase on angiotensin II modulation of CD4+ CD69, CCR5, and CD44 expression, as determined using flow cytometry. Experiments were performed in C57BL/6 and p47phox −/− mice. (C) Role of the NADPH oxidase in modulating aortic T cell infiltration, as determined by levels of ε chain CD3 mRNA. Measurements were obtained in sham and angiotensin II–infused mice. (D; left) Western blots examining NADPH oxidase cytosolic (p47phox and p67phox) and membrane (p22phox and gp91phox) subunits in isolated T cells from sham-infused and angiotensin II–treated mice. Purity of T cell preparations was >98% as determined by flow cytometry, and it did not differ between groups. (right) Densitometric analysis of four separate experiments. (E) T cell production of O2 ·− determined by electron spin resonance at baseline and in response to the phorbol ester PMA in T cells from sham and angiotensin II–infused mice. (left) Sample time scans of the low field peak of the CAT1-H spectra; (right) mean data from five experiments. *, P < 0.05 vs. sham; †, P < 0.02 vs. C57BL/6; #, P < 0.05 PMA vs. basal; ¶, P < 0.03 vs. αCD3 alone. Data are expressed as the means ± the SEM.
Figure 8.
Figure 8.
Role of cytokines in blood pressure regulation and vascular O2·− production. (A) Production of TNF-α (top) and IFN-γ (bottom) measured by cytometric bead array from anti-CD3–stimulated peripheral blood T cells isolated from C57BL/6 and p47phox−/− mice infused with saline (sham) or angiotensin II for 14 d (n = 8 in each group). (B) Anti-CD3–stimulated production of TNF-α from spleen-derived T cells in response to in vitro coincubation without (vehicle; n = 6) or with 100 nm angiotensin II (Ang II; n = 6). (C) Noninvasive blood pressure measurements at baseline and during angiotensin II infusion measured by tail cuff in mice injected IP with control IgG (n = 4) or with anti-TNFα therapy (etanercept, ETA; 8 mg/kg; n = 6) 3 d before and every 3 d throughout the experiment. (D) Aortic O2 ·− levels after angiotensin II infusion in control mice or mice injected with etanercept (n = 6) compared with sham-infused mice. In preliminary experiments, we showed that ETA did not directly inhibit contraction of vascular rings in response to angiotensin II. *, P < 0.05 vs. sham; ¶, P < 0.05 vs. α-CD3 + vehicle using a paired one-tailed t test; †, P < 0.05 vs. control Ig; #, P < 0.01 vs. Ang II alone. Data are expressed as the means ± the SEM.

References

    1. Wang, Y., and Q.J. Wang. 2004. The prevalence of prehypertension and hypertension among US adults according to the new joint national committee guidelines: new challenges of the old problem. Arch. Intern. Med. 164:2126–2134. - PubMed
    1. Chobanian, A.V., G.L. Bakris, H.R. Black, W.C. Cushman, L.A. Green, J.L. Izzo Jr., D.W. Jones, B.J. Materson, S. Oparil, J.T. Wright Jr., and E.J. Roccella. 2003. The Seventh Report of the Joint National Committee on Prevention, Detection, Evaluation, and Treatment of High blood pressure: the JNC 7 report. JAMA. 289:2560–2572. - PubMed
    1. Lewington, S., R. Clarke, N. Qizilbash, R. Peto, and R. Collins. 2002. Age-specific relevance of usual blood pressure to vascular mortality: a meta-analysis of individual data for one million adults in 61 prospective studies. Lancet. 360:1903–1913. - PubMed
    1. Naviar, G.L., M.C. Prieto-Carrasquero, and H. Kobori. 2006. Molecular Aspects of the renal renin-angiotensin system. In Molecular Mechanisms in Hypertension. R. Re, D. DiPette, E. Schiffrin, and R. Sowers J., editors. Taylor and Francis, London and New York. 3–14 pp.
    1. Kim, S., and H. Iwao. 2000. Molecular and cellular mechanisms of angiotensin II-mediated cardiovascular and renal diseases. Pharmacol. Rev. 52:11–34. - PubMed

Publication types

MeSH terms