. 2007 Sep 24;178(7):1295-307.
doi: 10.1083/jcb.200610139. Epub 2007 Sep 17.

The EphA4 receptor regulates dendritic spine remodeling by affecting beta1-integrin signaling pathways

Affiliations

The EphA4 receptor regulates dendritic spine remodeling by affecting beta1-integrin signaling pathways

Caroline Bourgin et al. J Cell Biol. .

Abstract

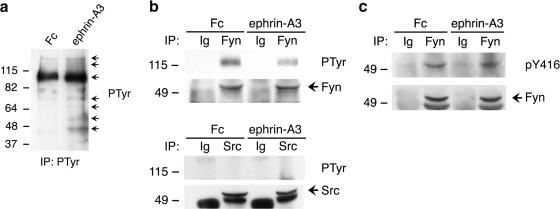
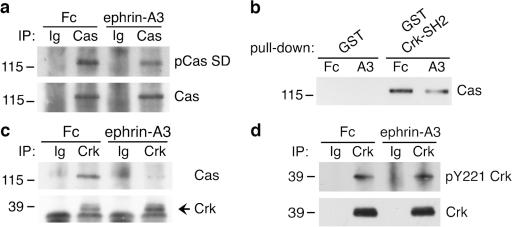
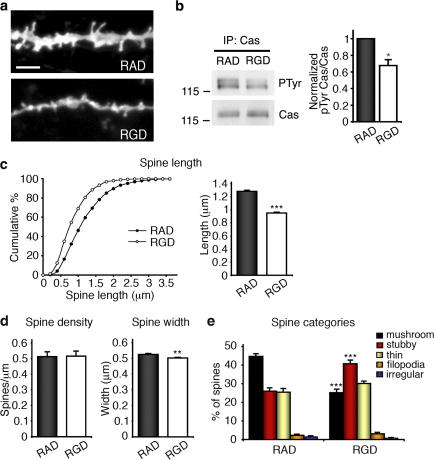
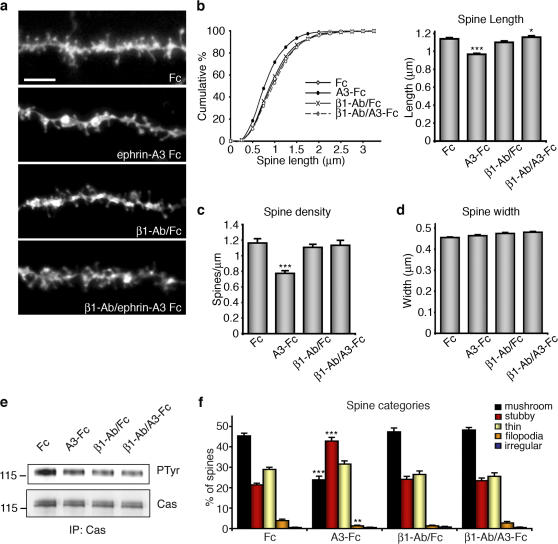
Remodeling of dendritic spines is believed to modulate the function of excitatory synapses. We previously reported that the EphA4 receptor tyrosine kinase regulates spine morphology in hippocampal pyramidal neurons, but the signaling pathways involved were not characterized (Murai, K.K., L.N. Nguyen, F. Irie, Y. Yamaguchi, and E.B. Pasquale. 2003. Nat. Neurosci. 6:153-160). In this study, we show that EphA4 activation by ephrin-A3 in hippocampal slices inhibits integrin downstream signaling pathways. EphA4 activation decreases tyrosine phosphorylation of the scaffolding protein Crk-associated substrate (Cas) and the tyrosine kinases focal adhesion kinase (FAK) and proline-rich tyrosine kinase 2 (Pyk2) and also reduces the association of Cas with the Src family kinase Fyn and the adaptor Crk. Consistent with this, EphA4 inhibits beta1-integrin activity in neuronal cells. Supporting a functional role for beta1 integrin and Cas inactivation downstream of EphA4, the inhibition of integrin or Cas function induces spine morphological changes similar to those associated with EphA4 activation. Furthermore, preventing beta1-integrin inactivation blocks the effects of EphA4 on spines. Our results support a model in which EphA4 interferes with integrin signaling pathways that stabilize dendritic spines, thus modulating synaptic interactions with the extracellular environment.


Figures

Figure 1.
Figure 1.
Ephrin-A3 Fc treatment of hippocampal slices decreases the association of Fyn with a 120-kD tyrosine-phosphorylated protein. (a) Ephrin-A3 Fc increases the tyrosine phosphorylation of several proteins in P6 mouse hippocampal slices, as indicated by the arrows. (b) A tyrosine-phosphorylated ∼120-kD band is detected in Fyn immunoprecipitates from postnatal day 10 hippocampal slices and is less prominent after ephrin-A3 Fc stimulation. The 120-kD band is not detectable in Src immunoprecipitates under the same experimental conditions. Control immunoprecipitates were with nonimmune antibodies (Ig). (c) Ephrin-A3 Fc stimulation of hippocampal slices does not affect Fyn activity. Fyn immunoprecipitates (IP) from Fc- and ephrin-A3 Fc–treated P12 hippocampal slices were probed with phosphospecific antibodies that recognize activated Fyn (pY416) and were reprobed with antibodies to Fyn. Fig. S1 (available at http://www.jcb.org/cgi/content/full/jcb.200610139/DC1) shows quantification and statistical analysis of the data shown in panels b and c.
Figure 2.
Figure 2.
Ephrin-A3 stimulation regulates the association of Fyn with Cas. (a and b) Lysates from P12 acute hippocampal slices were used for immunoprecipitation with Fyn antibodies. The immunoprecipitates were then probed with Fyn and FAK, Pyk2, or Cas antibodies as indicated. (c) Ephrin-A3 Fc reduces Cas binding to the SH2 and SH3 domains of Fyn. Lysates were incubated with equal amounts of purified GST fusion proteins containing the Fyn SH2 or SH2 and SH3 domains or only GST as a control. Bound proteins were probed with Cas antibodies. (d) Ephrin-A3 Fc decreases Fyn–Cas association, as shown by probing Fyn immunoprecipitates with Cas and Fyn antibodies. (e) Ephrin-A3 Fc decreases Cas tyrosine phosphorylation, as shown by probing Cas immunoprecipitates with phosphotyrosine antibodies (PTyr) and Cas antibodies. (f) Ephrin-A3 Fc decreases Cas tyrosine phosphorylation in hippocampal slices from EphA4+/+ mice but not in slices from EphA4−/− mice. Lysates from EphA4+/+ or EphA4−/− hippocampal slices were stimulated with ephrin-A3 Fc or Fc as a control. Cas immunoprecipitates were probed with phosphotyrosine antibodies (PTyr) and reprobed with Cas antibodies. Fig. S1 shows quantification and statistical analysis of the data shown in panels c–e. Fig. S2 (available at http://www.jcb.org/cgi/content/full/jcb.200610139/DC1) shows quantification of the data in panel f and an additional experiment similar to the one shown in panel f.
Figure 3.
Figure 3.
Ephrin-A3 regulates Cas phosphorylation in the substrate domain and association with Crk. (a) Ephrin-A3 Fc decreases the phosphorylation of Cas in the substrate domain. Cas immunoprecipitates from Fc- or ephrin-A3 Fc–treated hippocampal slices were probed with antibodies recognizing several tyrosine phosphorylation sites in the Cas substrate domain (Fonseca et al., 2004) and reprobed with antibodies to Cas. (b) Ephrin-A3 Fc decreases Cas binding to the SH2 domain of Crk. Equal amounts of GST-Crk SH2 domain and GST (as a control) were incubated with lysates from Fc- or ephrin-A3 Fc–treated hippocampal slices and probed with Cas antibodies. (c) Ephrin-A3 Fc reduces Crk–Cas association, as shown by probing Crk immunoprecipitates with Cas antibodies. (d) Ephrin-A3 Fc does not affect Crk phosphorylation on tyrosine 221, as shown by probing Crk immunoprecipitates with phosphospecific antibodies (pY221). Fig. S1 (available at http://www.jcb.org/cgi/content/full/jcb.200610139/DC1) shows quantification and statistical analysis of the data shown in panels a–d.
Figure 4.
Figure 4.
Cas is expressed in hippocampal neurons and enriched in the PSD. (a) Subcellular localization of EphA4 and Cas in a synaptosomal preparation from adult mouse brain. Equal amounts of protein from the indicated fractions were probed for EphA4, Cas, PSD-95 (postsynaptic marker), syntaxin (presynaptic marker), and the tyrosine phosphatase SHP2 (control present in all fractions). PSD, postsynaptic density fraction. (b) Cas is expressed in cultured hippocampal neurons but not in glial cells. Cas expression was detected by immunoblotting lysates from adult mouse brain and primary hippocampal neurons and glial cells.
Figure 5.
Figure 5.
Cas knockdown decreases dendritic spine density and length. (a) Cas siRNAs effectively and selectively reduce Cas expression. Immunoblot analysis of Cas levels in NIH3T3 cells transfected with four individual Cas siRNAs (siCas #1–4), a pool of the four siRNAs (siCas pool), a control siRNA (siControl #1) or no siRNA (none). Glyceraldehyde- 3-phosphate dehydrogenase (GADPH) levels were not affected. (b) Confocal images of dendrites from CA1 pyramidal neurons in cultured hippocampal slices cotransfected with the indicated siRNAs and EGFP-F as a marker. (c–e) Histograms show the mean spine density, length, and width of neurons transfected with Cas siRNAs. Densities are as follows: 0.75 ± 0.02 spines/μm (control #1), 0.49 ± 0.03 spines/μm (siCas pool), 0.38 ± 0.04 spines/μm (siCas #1), and 0.51 ± 0.04 spines/μm (siCas #4). Lengths are as follows: 1.24 ± 0.01 μm (control #1), 1.04 ± 0.01 μm (siCas pool), 1.07 ± 0.02 μm (siCas #1), and 1.07 ± 0.02 μm (siCas #4). (f) Percentage of spines in the indicated morphological categories. Statistical analysis was performed by ANOVA followed by Dunnett's posthoc test for comparisons of neurons transfected with Cas siRNAs to neurons transfected with a control siRNA. *, P < 0.05; **, P < 0.01. Error bars represent SEM. A total of n = 709–1,525 spines from 27–42 dendrites of 8–10 CA1 pyramidal neurons were analyzed per condition in three experiments. Additional experiments using a second control siRNA are shown in Fig. S3 (available at http://www.jcb.org/cgi/content/full/jcb.200610139/DC1). Bars (b), 5 μm; (f) 1 μm.
Figure 6.
Figure 6.
The Cas SH3 and Src-binding domains are important for the regulation of spine morphology. (a) Confocal images of dendrites from CA1 pyramidal neurons in hippocampal slices cotransfected with the indicated Cas constructs and EGFP-F as a marker. On the right are schematic representations of the constructs used for the transfections, including wild-type Cas, CasΔSD (Cas lacking the substrate domain), CasΔSH3 (Cas lacking the SH3 domain), and CasΔSB (Cas lacking the Src-binding domain). (b) Quantitative analysis of dendritic spine parameters in transfected neurons. Densities are as follows: 0.52 ± 0.02 spines/μm (control), 0.62 ± 0.02 spines/μm (Cas wild type), 0.53 ± 0.03 spines/μm (CasΔSD), 0.27 ± 0.02 spines/μm (CasΔSH3), and 0.27 ± 0.03 spines/μm (CasΔSB). (c) Percentage of spines in the indicated morphological categories. Statistical analysis was performed by ANOVA followed by Dunnett's posthoc test for comparisons of neurons transfected with Cas constructs to control-transfected neurons. *, P < 0.05; **, P < 0.01. Error bars represent SEM. A total of n = 478–2,182 spines from 23–53 dendrites of 6–10 CA1 neurons were analyzed per condition in three experiments. Bar, 5 μm.
Figure 7.
Figure 7.
EphA4 activation by ephrin-A3 Fc inhibits β1 integrin–mediated adhesion. (a and b) Ephrin-A3 Fc decreases the tyrosine phosphorylation of FAK (a) and Pyk2 (b) in P12 hippocampal slices. Immunoprecipitated FAK and Pyk2 were probed by immunoblotting with an antiphosphotyrosine (PTyr) antibody and reprobed with FAK or Pyk2 antibodies. (c and d) Ephrin-A3 Fc decreases attachment of the HT22 hippocampal cell line and the neuronal-like EphA4 B35 cell line to fibronectin (FN) but not to poly-l-lysine (PLL). Ephrin-A3 Fc also reduces Cas tyrosine phosphorylation in both cell lines. Immunoprecipitated Cas was probed by immunoblotting with an antiphosphotyrosine (PTyr) antibody and reprobed with a Cas antibody. (e) Ephrin-A3 Fc decreases the levels of active β1 integrin in cultured neuronal cells. HT22 cells plated on fibronectin and stimulated with ephrin-A3 Fc, Fc, or Mn2+ (an ion known to promote integrin activation) were incubated with a low concentration (2 μg/ml) of rat 9EG7 antibody or IgG (control) to detect active β1 integrin. The bound antibodies were detected by immunoblotting with an anti–rat antibody. For quantification of active β1 integrin, the signal in the Ig lane (background) was subtracted from the signal in the β1 lane and normalized to total β1 integrin. (f) Ephrin-A3 Fc does not affect the levels of β1 integrins on the cell surface. Cells were treated as described in panel e, and surface proteins were labeled with biotin, isolated with streptavidin beads, and probed by immunoblotting with an anti–β1-integrin antibody. Immunoblotting of the cell lysates shows similar levels of total β1 integrin. Statistical analyses were performed by ANOVA followed by Tukey's posthoc test (c and d) or Dunnett's posthoc test (e). **, P < 0.01; ***, P < 0.001 for comparison with Fc-treated cells. Error bars indicate SEM from three independent experiments. Fig. S1 (available at http://www.jcb.org/cgi/content/full/jcb.200610139/DC1) shows quantification and statistical analysis of the data shown in panels a–d and f.
Figure 8.
Figure 8.
Integrin activity regulates spine morphology. (a) Dendritic spines of pyramidal neurons have shorter spines when treated with RGD peptide than when treated with control RAD (Arg-Ala-Asp) peptide. Cultured hippocampal slices transfected with EGFP-F as a marker were incubated for 24 h with 170 μM RAD or 170 μM RGD peptide. Representative confocal micrographs of dendrites from transfected CA1 pyramidal neurons are shown. (b) Cas is dephosphorylated in RGD-treated hippocampal slices. Lysates from cultured hippocampal slices treated as described in panel a were used to immunoprecipitate Cas, and the immunoprecipitates were probed with phosphotyrosine antibodies (PTyr) and reprobed with Cas antibodies. For quantification, Cas phosphorylation levels were normalized to the total amount of Cas immunoprecipitated and to the RAD control condition. The histogram represents mean ± SEM from three experiments. *, P < 0.05 by t test. (c) Quantification of spine length in RGD- and RAD-treated slices: 1.28 ± 0.02 μm for RAD versus 0.95 ± 0.01 μm for RGD. P < 0.001 (Kolmogorov-Smirnov test and t test). (d) Quantification of spine density and spine width. (e) Morphological categories of spines. Statistical analyses were performed with the t test. *, P < 0.05; **, P < 0.01; ***, P < 0.001 for comparison between RGD- and RAD-treated spines. A total of n = 1,250–1,700 spines from 36–56 dendrites of 8–13 CA1 neurons were analyzed per condition in three experiments. Error bars indicate SEM. Bar, 5 μm.
Figure 9.
Figure 9.
Preventing β1-integrin inactivation counteracts ephrin-A3 Fc–induced spine retraction. (a) Postnatal day 23–25 acute hippocampal slices were pretreated with a high concentration (20 μg/ml) of the 9EG7 antibody to promote β1-integrin activation before stimulation with ephrin-A3 Fc or Fc as a control. Representative confocal micrographs of DiI-labeled dendritic spines of CA1 pyramidal neurons are shown. (b) Quantitative analysis of dendritic spine length. Lengths are as follows: 1.14 ± 0.01 μm for Fc versus 0.97 ± 0.01 μm for A3-Fc (P < 0.0001 by Kolmogorov-Smirnov test and P < 0.001 by ANOVA and Bonferroni's posthoc test) and 1.10 ± 0.01 μm for β1-Ab/Fc versus 1.15 ± 0.01 μm for β1-Ab/ephrin-A3-Fc (P > 0.05 by Kolmogorov-Smirnov test, ANOVA, and Bonferroni's posthoc test). (c) Quantitative analysis of dendritic spine density. Densities are as follows: 1.16 ± 0.05 spines/μm for Fc versus 0.77 ± 0.03 spines/μm for A3-Fc and 1.10 ± 0.04 spines/μm for β1-Ab/Fc versus 1.13 ± 0.06 spines/μm for β1-Ab/ephrin-A3-Fc. (d) Quantitative analysis of dendritic spine width. (e) Treatment with the 9EG7 antibody prevents Cas dephosphorylation after ephrin-A3 Fc treatment. Lysates from hippocampal slices treated as described in panel a were used to immunoprecipitate Cas, and the immunoprecipitates were probed with phosphotyrosine antibodies (PTyr) and reprobed with Cas antibodies. (f) Morphological categories of spines. Statistical analyses in panels c, d, and f were performed with multifactorial ANOVA and Tukey's posthoc test (c and f) or Bonferroni's posthoc test (d). *, P < 0.05; **, P < 0.01; ***, P < 0.001 for comparison between Fc versus ephrin-A3 Fc or for β1-Ab/Fc versus β1-Ab/ephrin-A3 Fc. In panel d, P < 0.01 for the comparison of Fc versus β1-Ab/Fc. A total of n = 1,071–1,341 spines from 19–24 dendrites of 9–10 CA1 neurons were analyzed per condition in three experiments. Fig. S1 (available at http://www.jcb.org/cgi/content/full/jcb.200610139/DC1) shows quantification and statistical analysis of the data shown in panel e. Error bars indicate SEM. Bar, 5 μm.

Similar articles

Cited by

References

    1. Arnaout, M.A., B. Mahalingam, and J.P. Xiong. 2005. Integrin structure, allostery, and bidirectional signaling. Annu. Rev. Cell Dev. Biol. 21:381–410. - PubMed
    1. Bazzoni, G., D.T. Shih, C.A. Buck, and M.E. Hemler. 1995. Monoclonal antibody 9EG7 defines a novel beta 1 integrin epitope induced by soluble ligand and manganese, but inhibited by calcium. J. Biol. Chem. 270:25570–25577. - PubMed
    1. Bernard-Trifilo, J.A., E.A. Kramar, R. Torp, C.Y. Lin, E.A. Pineda, G. Lynch, and C.M. Gall. 2005. Integrin signaling cascades are operational in adult hippocampal synapses and modulate NMDA receptor physiology. J. Neurochem. 93:834–849. - PubMed
    1. Boda, B., S. Alberi, I. Nikonenko, R. Node-Langlois, P. Jourdain, M. Moosmayer, L. Parisi-Jourdain, and D. Muller. 2004. The mental retardation protein PAK3 contributes to synapse formation and plasticity in hippocampus. J. Neurosci. 24:10816–10825. - PMC - PubMed
    1. Bonhoeffer, T., and R. Yuste. 2002. Spine motility. Phenomenology, mechanisms, and function. Neuron. 35:1019–1027. - PubMed

Publication types

MeSH terms