. 2007 Nov;27(22):7918-34.
doi: 10.1128/MCB.00099-07. Epub 2007 Sep 17.

EWS/FLI-1 induces rapid onset of myeloid/erythroid leukemia in mice

Affiliations

EWS/FLI-1 induces rapid onset of myeloid/erythroid leukemia in mice

Enrique C Torchia et al. Mol Cell Biol. 2007 Nov.

Abstract

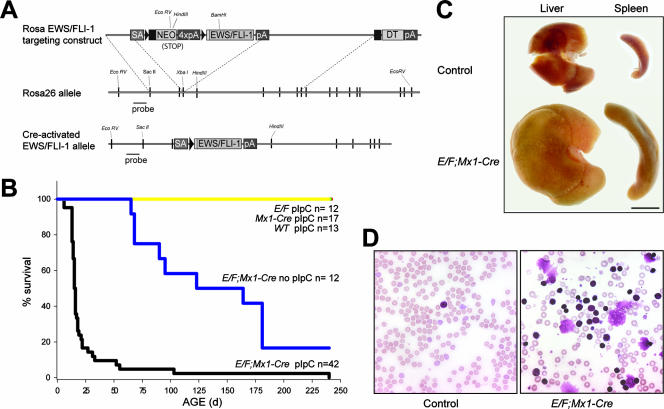
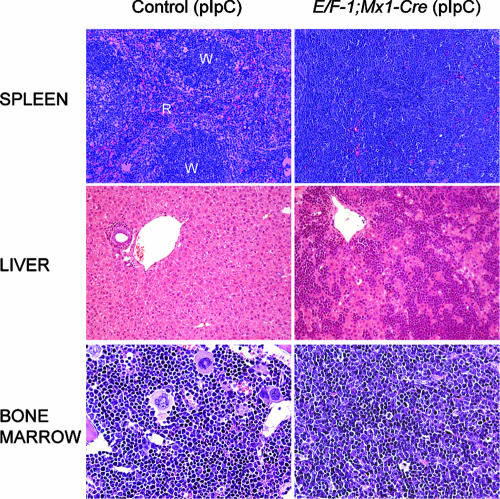
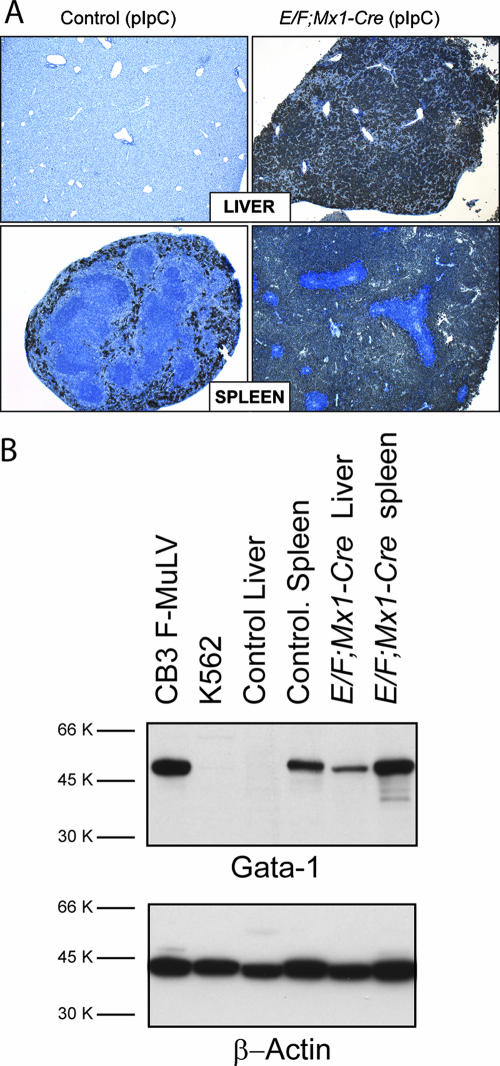
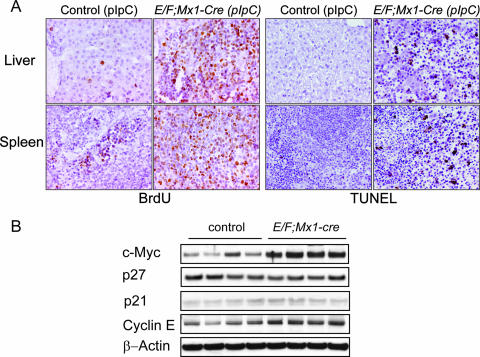
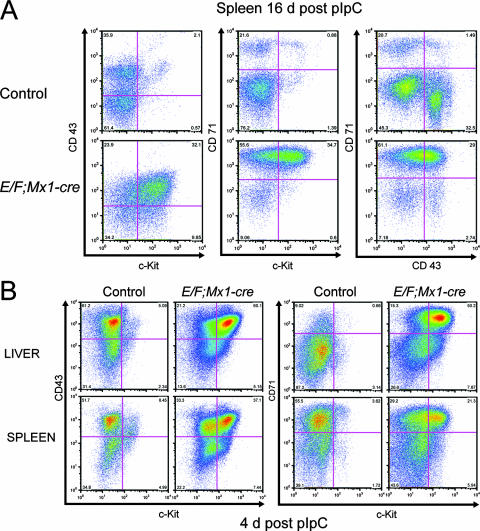
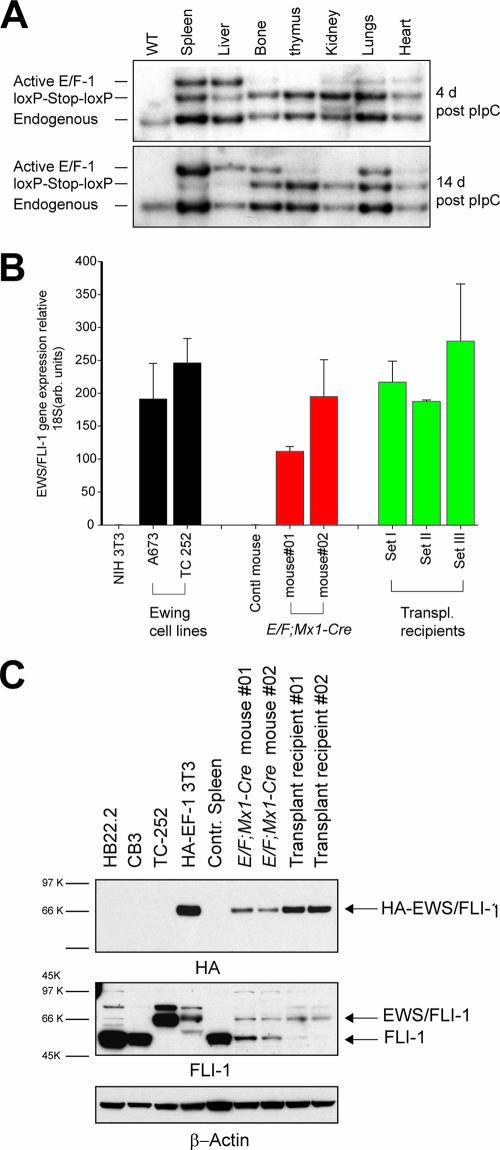
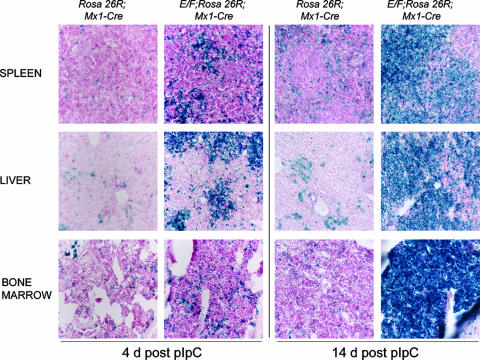
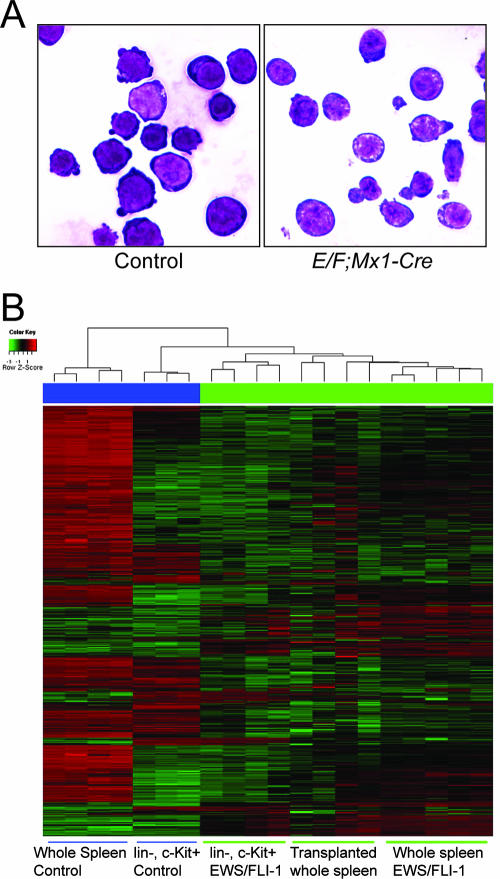
EWS/FLI-1 is a chimeric oncogene generated by chromosomal translocation in Ewing tumors, a family of poorly differentiated pediatric tumors arising predominantly in bone but also in soft tissue. The fusion gene combines sequences encoding a strong transactivating domain from the EWS protein with the DNA binding domain of FLI-1, an ETS transcription factor. A related fusion, TLS/ERG, has been found in myeloid leukemia. To determine EWS/FLI-1 function in vivo, we engineered mice with Cre-inducible expression of EWS/FLI-1 from the ubiquitous Rosa26 locus. When crossed with Mx1-cre mice, Cre-mediated activation of EWS/FLI-1 resulted in the rapid development of myeloid/erythroid leukemia characterized by expansion of primitive mononuclear cells causing hepatomegaly, splenomegaly, severe anemia, and death. The disease could be transplanted serially into naïve recipients. Gene expression profiles of primary and transplanted animals were highly similar, suggesting that activation of EWS/FLI-1 was the primary event leading to disease in this model. The Cre-inducible EWS/FLI-1 mouse provides a novel model system to study the contribution of this oncogene to malignant disease in vivo.


Figures

FIG. 1.
FIG. 1.
Rosa E/F; Mx1-cre mice treated with pIpC show severe pathology. (A) Construction of Cre-inducible Rosa EWS/FLI-1 targeting vector. HA-tagged EWS/FLI-1 was placed downstream of a splice acceptor (SA)-loxP-stop-loxP cassette. loxP sites are shown as triangles. The construct was then introduced into W9.5 ES cells and the cells selected with G418. A probe outside the arms of homology was used to screen ES clones for the knock-in allele. The active EWS/FLI-1 allele is produced by Cre-mediated recombination between loxP sites, thereby removing the stop cassette. (B) Survival of E/F; Mx1-cre mice following treatment with 500 μg pIpC at postnatal days 2 to 3. Greater than 80% of E/F; Mx1-cre mice died before 25 days of age, while no mortality or pathology was observed in pIpC-treated controls with genotypes E/F or Mx1-cre, or nontransgenic littermates. Untreated E/F; Mx1-cre mice showed delayed pathology and mortality compared to treated mice. (C) Photograph of spleens and livers collected from pIpC-treated E/F (control) and E/F; Mx1-cre littermates sacrificed at 19 days of age. Hepatomegaly and splenomegaly were consistently found in moribund E/F; Mx1-cre mice. Bar, 0.5 cm. (D) Presence of elevated nucleated cells in peripheral blood smears of pIpC-treated E/F; Mx1-cre mice analyzed at 16 days of age. Blood from a pIpC-treated E/F mouse is shown as a control. Magnification, ×400.
FIG. 2.
FIG. 2.
Mononuclear cell infiltration of spleen, liver, and bone marrow of E/F; Mx1-cre mice. Results of histological examination of hematoxylin and eosin-stained sections from paraffin-embedded tissue are shown. The normal architecture of the spleen observed in pIpC-treated Mx1-cre or E/F (control) mice is disrupted by the presence of primitive mononuclear cells in pIpC-treated E/F; Mx1-cre mice. The white pulp (W), the lymphoid component of the spleen, is markedly reduced, while the red pulp (R) is greatly expanded by a myeloid/erythroid component, resulting in the homogeneous appearance of the spleen in pIpC-treated E/F; Mx1-cre mice compared to controls. The livers and bone marrow of pIpC-treated E/F; Mx1-cre mice were infiltrated by primitive mononuclear cells. Mice shown were analyzed at 17 days of age. Magnification, ×200 for spleen and liver sections and ×500 for bone marrow.
FIG. 3.
FIG. 3.
Expression of Gata-1 in tissues from E/F; Mx1-cre mice. (A) Gata-1 immunohistochemistry was performed on tissue sections from pIpC-treated Mx1-cre (control) and E/F; Mx1-cre mice. In control mice, the myeloid/erythroid marker Gata-1 is present in the red pulp of the spleen, while it is absent in the livers of these animals. However, strong staining of Gata-1 is observed in infiltrating mononuclear cells in spleens and livers of E/F; Mx1-cre mice. Note the exclusion of Gata-1 staining in lymphoid cells in the spleen. Mice were analyzed at 15 days of age. Magnification, ×50. (B) Gata-1 was detected in 30 μg total cellular protein from F-MuLV cells, K562 (CML) cells, livers and spleens of a pIpC-treated Mx1-cre mice (control), and pIpC-treated E/F; Mx1-cre mice (23 days old) using Gata-1 (N6) antiserum. Note the strong detection of a 50-kDa band in F-MuLV and control spleen lysates, while this band was weakly detectable in K562 cells and absent in control liver lysates. Gata-1 was strongly detected in livers of E/F; Mx1-cre mice, consistent with the presence of Gata-1+ malignant cells, as shown as by Gata-1 immunohistochemistry on liver tissue sections from diseased E/F; Mx1-cre mice. Gata-1 was also strongly detected in spleen lysates from E/F; Mx1-cre mice. The blot was stripped and reprobed with β-actin antiserum.
FIG. 4.
FIG. 4.
Proliferation and apoptosis in livers and spleens of E/F; Mx1-cre mice. (A) To determine actively proliferating cells in E/F (control) or E/F; Mx1-cre mice, 14-day-old mice were injected with BrdU and tissues were analyzed after a 2-h pulse. Infiltrating cells present in the spleens and livers of diseased E/F; Mx1-cre mice showed significant incorporation of BrdU, indicating malignant cells were actively proliferating. In contrast, BrdU incorporation was observed in few hepatocytes in livers and scattered myeloid cells in spleens of control animals. Magnification, ×400. TUNEL staining in spleens and livers of control or E/F; Mx1-cre mice is shown on the right. Numerous TUNEL-positive cells are observed in infiltrating cells present in livers and spleens of diseased E/F; Mx1-cre mice (18 days old). In contrast, no TUNEL-positive cells were observed in livers and scattered positive cells were observed in spleens of Mx1-cre mice (controls). Magnification, ×200. (B) c-Myc, p27, p21, and cyclin E were detected in 30 μg total cellular protein from the spleens of E/F; Mx1-cre or E/F (control) mice 4 days after treatment with pIpC. Note the strong upregulation of c-Myc in four E/F; Mx1-cre mice derived from the same litter. Detection of β-actin on the same blots is shown as a loading control.
FIG. 5.
FIG. 5.
Enrichment of c-Kit/CD43/CD71-positive cells in spleens and livers of E/F; Mx1-cre mice. Spleen and liver cells were stained with fluorescently labeled c-Kit, CD43, and CD71 antibodies and analyzed by FACS. (A) Spleens from pIpC-treated E/F; Mx1-cre mice were enriched in cells coexpressing c-Kit, CD43, and CD71. The same population of cells was also present in spleens of pIpC-treated control mice, but at a much lower frequency. Mice were analyzed 16 days after pIpC treatment. (B) Expansion of c-Kit+ CD43+ and c-Kit+ CD71+ cells is evident in spleens and livers of 7-day-old E/F; Mx1-cre mice, 4 days after pIpC treatment. c-Kit dim CD43+ and C-kit dim CD71+ cells are present in livers and spleens of control mice and may be the origin of the malignant cells in E/F; Mx1-cre mice. Control mice were pIpC-treated E/F mice.
FIG. 6.
FIG. 6.
Cre-activated expression of EWS/FLI-1 from the Rosa26 locus. (A) Southern blot analysis of E/F; Mx1-cre mice 4 and 14 days after pIpC treatment to induce cre expression. DNA was extracted from wild-type tissue or the indicated tissues from pIpC-treated E/F; Mx1-cre mice, digested with HindIII/EcoRV, and hybridized with a Rosa26 probe. The 3-kb band represents the endogenous Rosa26 allele. The “loxp-Stop-loxp” band (4.3 kb) represents the Cre-inducible EWS/FLI-1 allele. Deletion of the stop cassette results in the active EWS/FLI-1 allele, the 5.1-kb band. In E/F; Mx1-cre mice 4 days after pIpC treatment, strong Cre-mediated recombination was evident in spleen and liver. At 14 days after pIpC treatment, deletion of the stop cassette was almost complete in liver and spleen. Strong recombination was evident in leg bones and lungs. (B) Real-time RT-PCR was used to detect expression levels of EWS/FLI-1 mRNA in spleens from E/F; Mx1-cre mice 17 days after pIpC treatment and transplanted recipient mice. EWS/FLI-1 mRNA levels were normalized to ribosomal 18S. The relative levels of EWS/FLI-1 mRNA detected in two Ewing cell lines are shown for comparison. Nontransgenic spleen cells were used as a control. (C) Detection of EWS/FLI-1 protein in spleen (30 μg) lysates from primary (18- and 23-day-old mice) and transplanted recipient mice was performed using a biotinylated anti-HA antibody. Lysate from NIH 3T3 cells expressing HA-EWS/FLI-1 from a viral promoter was used as a positive control. The blot was stripped and reprobed using an antibody that detects the C terminus of FLI-1. Lysate from the Ewing cell line TC252 was used as a control for EWS/FLI-1. The blot was stripped and reprobed for β-actin.
FIG. 7.
FIG. 7.
Expansion of cells with Cre activity in E/F; Mx1-cre; Rosa26R mice. X-Gal staining of frozen sections of tissue from E/F; Mx1-cre; Rosa26R or Mx1-cre; Rosa26R (control) mice 4 and 14 days after pIpC treatement. At 4 days posttreatment, spleen, liver, and bone marrow cells of Mx1-cre; Rosa26R mice contained scattered X-Gal-positive (blue) cells, indicating deletion of the stop cassette and expression of the reporter. In contrast, livers and spleens of E/F; Mx1-cre; Rosa26R mice contained clusters of X-Gal-positive primitive mononuclear blast cells, and bone marrow of the same animal contained increased numbers of X-Gal-positive cells. At 14 days after pIpC treatment, a substantial increase in the relative numbers of X-Gal-positive cells was observed in all three tissues of E/F; Mx1-cre; Rosa26R mice, while control mice showed scattered blue cells in spleens, liver, and bone marrow. Magnification, ×200.
FIG. 8.
FIG. 8.
Expression profiling of cells with EWS/FLI-1 activation. (A) Isolation of lineage-negative, c-Kit+ cells from E/F; Mx1-cre mice. A cytospin preparation of magnetically sorted spleen cells was stained with May-Grumwald-Giemsa. Lin c-Kit+ cells from pIpC-treated E/F (control) or E/F; Mx1-cre mice show a blast-like appearance. Cells shown were isolated from 16-day-old mice. Magnification, ×1,000. (B) RNA was isolated from purified Lin c-Kit+ cells or whole spleen tissue. Expression array data were generated on Affymetrix Murine 430 v. 2.0 chips. Unsupervised hierarchical clustering of the 1,000 most variable probe sets from control, E/F; Mx1-cre, and transplanted recipients and Lin c-Kit+ cells from control and E/F; Mx1-cre (EWS/FLI-1) mice.
FIG. 9.
FIG. 9.
Quantitative PCR validation of myeloid/erythroid markers in Lin c-Kit+ cells from E/F; Mx1-cre mice. SYBR Green quantative PCR was used to quantitate the relative levels of Gata-1, Gata-2, NF-E2, erythropoietin receptor, Scl/Tal-1, and the thrombopoietin receptor c-Mpl in Lin c-Kit+ cells from control or E/F; Mx1-cre mice. Reverse-transcribed RNAs from whole wild-type spleen, bone marrow, brain, or cultured 3T3 cells were used as control samples. Averages ± standard deviations are shown.

References

    1. Abaan, O. D., A. Levenson, O. Khan, P. A. Furth, A. Uren, and J. A. Toretsky. 2005. PTPL1 is a direct transcriptional target of EWS-FLI1 and modulates Ewing's sarcoma tumorigenesis. Oncogene 24:2715-2722. - PubMed
    1. Akashi, K., D. Traver, T. Miyamoto, and I. L. Weissman. 2000. A clonogenic common myeloid progenitor that gives rise to all myeloid lineages. Nature 404:193-197. - PubMed
    1. Anderson, M. K., G. Hernandez-Hoyos, R. A. Diamond, and E. V. Rothenberg. 1999. Precise developmental regulation of Ets family transcription factors during specification and commitment to the T cell lineage. Development 126:3131-3148. - PubMed
    1. Arvand, A., and C. T. Denny. 2001. Biology of EWS/ETS fusions in Ewing's family tumors. Oncogene 20:5747-5754. - PubMed
    1. Asari, S., S. Okada, Y. Ohkubo, A. Sakamoto, M. Arima, M. Hatano, Y. Kuroda, and T. Tokuhisa. 2004. Beta-galactosidase of ROSA26 mice is a useful marker for detecting the definitive erythropoiesis after stem cell transplantation. Transplantation 78:516-523. - PubMed

Publication types

MeSH terms