. 2007 Sep 25;104(39):15472-7.
doi: 10.1073/pnas.0707351104. Epub 2007 Sep 17.

Tumor-suppressive miR-34a induces senescence-like growth arrest through modulation of the E2F pathway in human colon cancer cells

Affiliations

Tumor-suppressive miR-34a induces senescence-like growth arrest through modulation of the E2F pathway in human colon cancer cells

Hiroshi Tazawa et al. Proc Natl Acad Sci U S A. .

Abstract

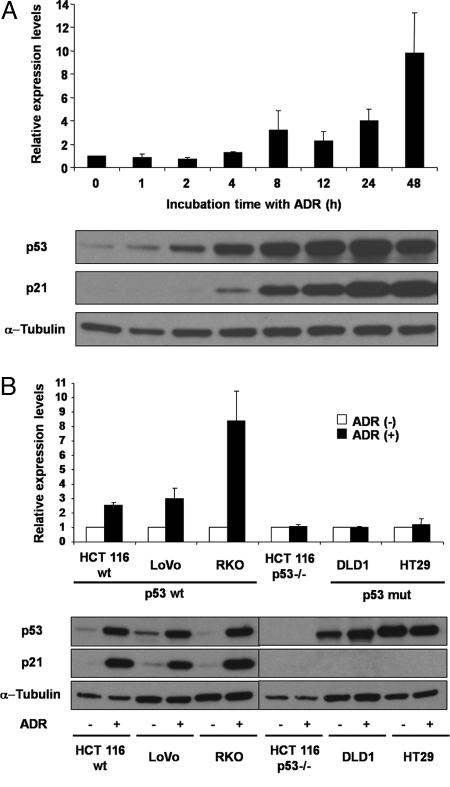
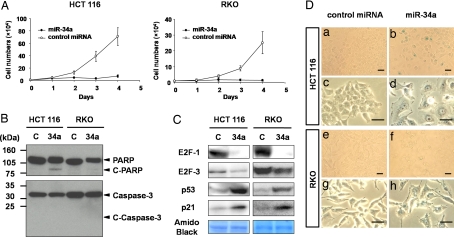
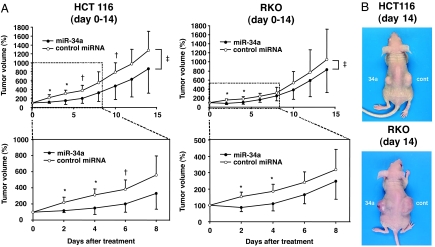
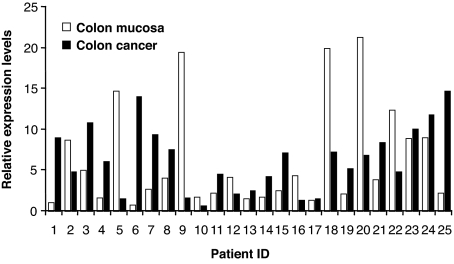
Accumulating evidence suggests a role for microRNAs in human carcinogenesis as novel types of tumor suppressors or oncogenes. However, their precise biological role remains largely elusive. In the present study, we aimed to identify microRNA species involved in the regulation of cell proliferation. Using quantitative RT-PCR analysis, we demonstrated that miR-34a was highly up-regulated in a human colon cancer cell line, HCT 116, treated with a DNA-damaging agent, adriamycin. Transient introduction of miR-34a into two human colon cancer cell lines, HCT 116 and RKO, caused complete suppression of cell proliferation and induced senescence-like phenotypes. Moreover, miR-34a also suppressed in vivo growth of HCT 116 and RKO cells in tumors in mice when complexed and administered with atelocollagen for drug delivery. Gene-expression microarray and immunoblot analyses revealed down-regulation of the E2F pathway by miR-34a introduction. Up-regulation of the p53 pathway was also observed. Furthermore, 9 of 25 human colon cancers (36%) showed decreased expression of miR-34a compared with counterpart normal tissues. Our results provide evidence that miR-34a functions as a potent suppressor of cell proliferation through modulation of the E2F signaling pathway. Abrogation of miR-34a function could contribute to aberrant cell proliferation, leading to colon cancer development.


Conflict of interest statement

The authors declare no conflict of interest.

Figures

Fig. 1.
Fig. 1.
Induction of miR-34a expression after treatment with ADR in colon cancer cell lines with wild-type p53. (A) HCT 116 cells were incubated in the presence of ADR at a concentration of 100 ng/ml, and miR-34a expression was analyzed at the indicated time points by using quantitative real-time RT-PCR. The value for miR-34a at time 0 was set at 1, and the relative amounts of miR-34a at the other time points were plotted as fold induction. Immunoblots under the graph indicate the accumulation of p53 and p21 at each time point. α-Tubulin was used as a loading control. (B) Induction of miR-34a in p53 wild-type and p53-knockout or -mutated colon cancer cell lines after 16 h incubation in the culture medium with or without ADR. The relative amounts of miR-34a in ADR-treated cells were calculated as described above. Open and filled bars represent nontreated and ADR-treated cells, respectively. Immunoblots under the graph indicate the accumulation of p53 and p21 detected in the six colon cancer cell lines.
Fig. 2.
Fig. 2.
miR-34a inhibits cell proliferation and induces senescence-like phenotypes through down-regulation of E2F and up-regulation of p53/p21 in HCT 116 and RKO cells. (A) HCT 116 and RKO cells, seeded at 1.0 × 10⁴ cells in 24-well plates, were transfected with control miRNA (open circles) or miR-34a (filled circles) on day 0, and cells were counted on the days indicated. The data are expressed as mean values with standard deviations. Cultures were performed in triplicate. (B) Immunoblot analysis of apoptotic cell markers. Cell extracts from HCT 116 and RKO cells were subjected to immunoblot analysis by using anti-PARP and anti-caspase-3 antibodies. Lanes C and 34a indicate the lysates of cells transfected with control miRNA and miR-34a, respectively. The molecular sizes of the intact and cleaved forms of PARP (Upper) and those of caspase-3 (Lower) are indicated on the right. (C) Cells transfected with control miRNA (C) and miR-34a (34a) were incubated for 3 days, and cell lysates were then subjected to immunoblot analysis. Amido black staining for an 80-kDa protein in the immunoblot is shown as a protein loading control. Marked down-regulation of E2F-1 and -3, and up-regulation of p53 and p21 were observed after miR34a transfection in both HCT 116 and RKO cells. (D) Induction of senescence-like appearance in cells by miR-34a. Cells transfected with control miRNA (a, c, e, and g) or miR-34a (b, d, f, and h) were subjected to SA-β-gal staining. a, b, e, and f are low-magnification images for visualizing SA-β-gal-positive cells, and c, d, g, and h are high-magnification images for morphological observation. (Scale bars, 10 μm.)
Fig. 3.
Fig. 3.
Administration of miR-34a with atelocollagen suppresses tumor cell growth in vivo. (A) Upper graphs are growth curves of HCT 116 and RKO tumors after transplantation into nude mice with miR-34a/atelocollagen or control miRNA/atelocollagen complexes. The volume of the tumors derived from both cell lines at day 0, which was when control miRNA (open circles) and miR-34a (filled circles) treatment was performed, were set as 100%, and relative tumor volume was evaluated at 2-day intervals for 14 days and is plotted as the percentage relative to day 0. Lower graphs are enlarged images of the growth curves of tumors during the first 8 days after miR-34a administration. The data at each time point are expressed as mean values of 8 tumors in each experimental group with standard deviations. Note the significant suppression of tumor growth on days 2, 4, 6, and 10 for HCT 116 tumors, and on days 2 and 4 for RKO tumors (*, P < 0.005; †, P < 0.05). Significant differences (‡, P < 0.05) in the averaged tumor volumes were also observed in HCT 116 and RKO tumors between mir-34a- and control miRNA-administered tumors throughout the entire experimental period by adopting the linear mixed effect model (34). (B) Photographs illustrating representative features of mouse tumors derived from HCT 116 and RKO cells 14 days after treatment with control miRNA (cont) or miR-34a (34a).
Fig. 4.
Fig. 4.
Down-regulation of miR-34a expression in human colon cancer specimens. Quantitative real-time RT-PCR for miR-34a was carried out by using 25 surgical specimens of human colon cancer (filled bars) and paired noncancerous counterpart (open bars). The relative expression levels of miR-34a were calculated as described in Fig. 1.

Similar articles

Cited by

References

    1. Lengauer C, Kinzler KW, Vogelstein B. Nature. 1998;396:643–649. - PubMed
    1. Baylin SB, Ohm JE. Nat Rev Cancer. 2006;6:107–116. - PubMed
    1. Esteller M. Nat Rev Genet. 2007;8:286–298. - PubMed
    1. Tomaru Y, Hayashizaki Y. Cancer Sci. 2006;97:1285–1290. - PMC - PubMed
    1. Bartel DP. Cell. 2004;116:281–297. - PubMed

Publication types