. 2007 Oct 21;13(39):5208-16.
doi: 10.3748/wjg.v13.i39.5208.

CTGF, intestinal stellate cells and carcinoid fibrogenesis

Affiliations

CTGF, intestinal stellate cells and carcinoid fibrogenesis

M Kidd et al. World J Gastroenterol. .

Abstract

Aim: To investigate the role of small intestinal carcinoid tumor-derived fibrotic mediators, TGFbeta1 and CTGF, in the mediation of fibrosis via activation of an "intestinal" stellate cell.

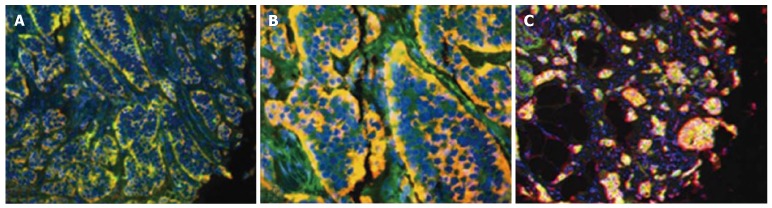
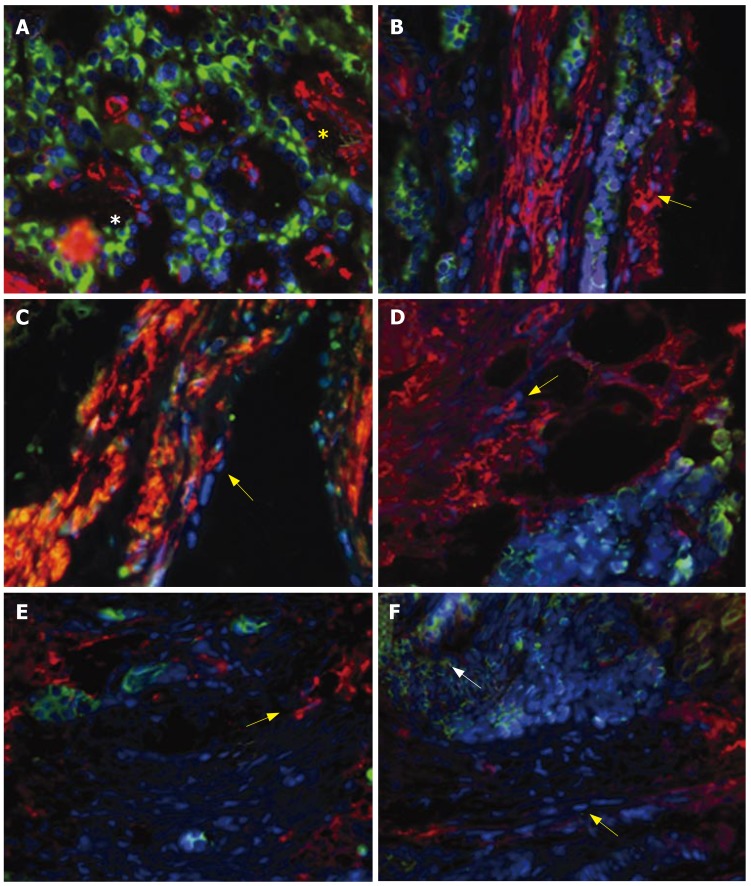
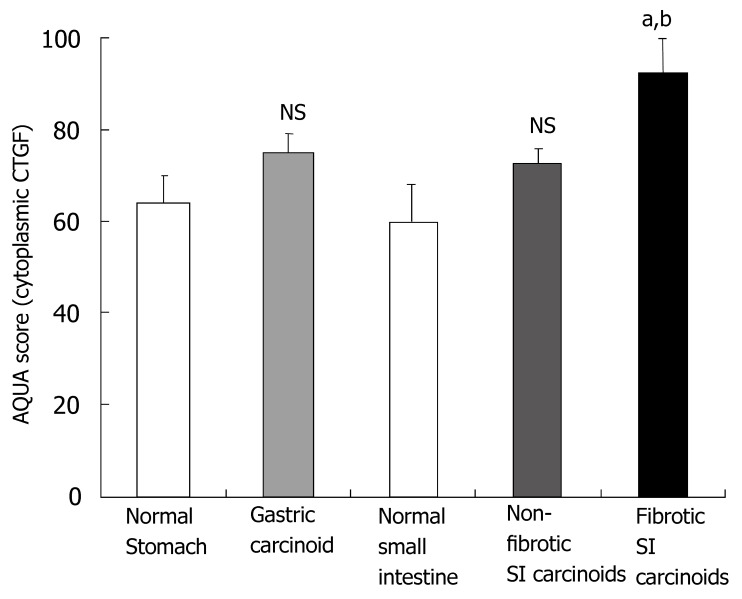
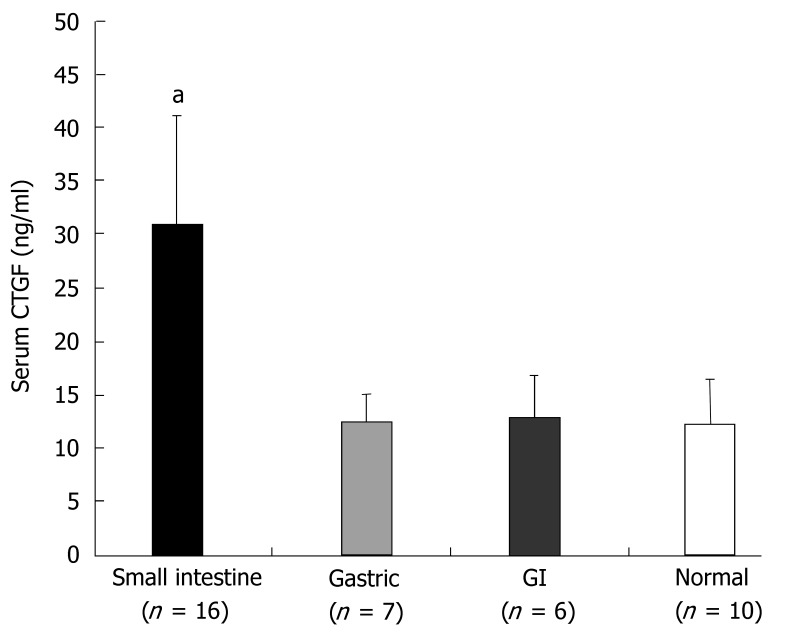
Methods: GI carcinoid tumors were collected for Q RT-PCR analysis of CTGF and TGFbeta1. Markers of stellate cell desmoplasia were identified in peritoneal fibrosis by immunohistochemistry and stellate cells cultured from fresh resected fibrotic tissue. CTGF and TGFbeta1 were evaluated using quantitative tissue array profiling (AQUA analysis) in a GI carcinoid tissue microarray (TMA) with immunostaining and correlated with clinical and histologically documented fibrosis. Serum CTGF was analyzed using a sandwich ELISA assay.

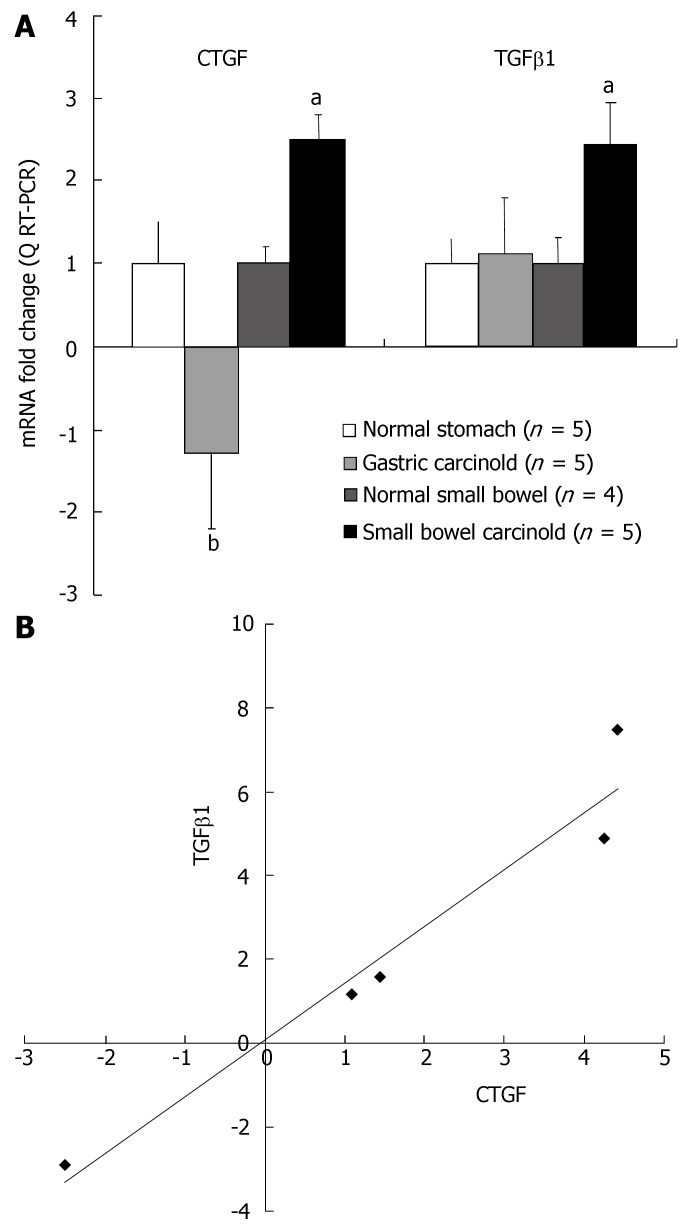
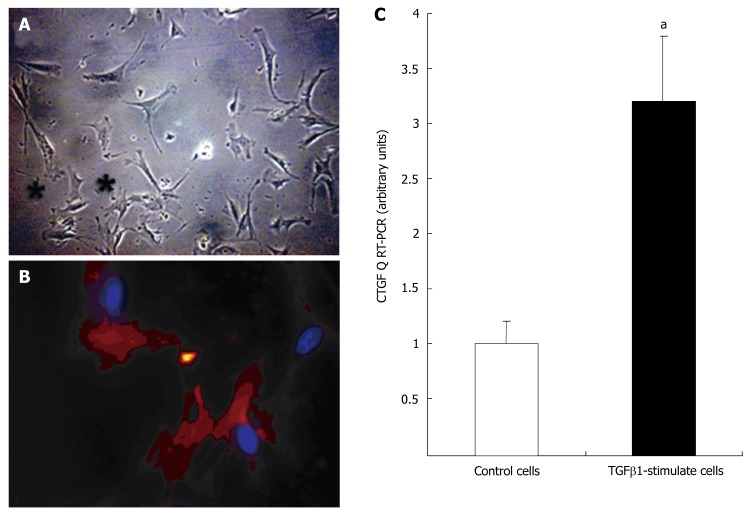
Results: Message levels of both CTGF and TGFbeta1 in SI carcinoid tumors were significantly increased (> 2-fold, P < 0.05) versus normal mucosa and gastric (non-fibrotic) carcinoids. Activated stellate cells and markers of stellate cell-mediated fibrosis (vimentin, desmin) were identified in histological fibrosis. An intestinal stellate cell was immunocytochemically and biochemically characterized and its TGFbeta1 (10-7M) initiated CTGF transcription response (> 3-fold, P < 0.05) demonstrated. In SI carcinoid tumor patients with documented fibrosis, TMA analysis demonstrated higher CTGF immunostaining (AQUA Score: 92 +/- 8; P < 0.05), as well as elevated TGFbeta1 (90.6 +/- 4.4, P < 0.05). Plasma CTGF (normal 12.5 +/- 2.6 ng/mL) was increased in SI carcinoid tumor patients (31 +/- 10 ng/mL, P < 0.05) compared to non-fibrotic GI carcinoids (< 15 ng/mL).

Conclusion: SI carcinoid tumor fibrosis is a CTGF/TGFbeta1-mediated stellate cell-driven fibrotic response. The delineation of the biology of fibrosis will facilitate diagnosis and enable development of agents to obviate its local and systemic complications.


Figures

Figure 1
Figure 1
A: Message levels of both CTGF and TGFβ1 determined by Q RT-PCR. Levels were corrected against expression of the housekeeping gene, GAPDH, compared to similarly corrected gene levels in normal mucosa, and represented as fold increase over normal (1.0). TGFβ1 was significantly over-expressed (about 2.5-fold) in SI carcinoid tumor samples compared to normal mucosa (aP < 0.05) but not the gastric carcinoids. CTGF was significantly over-expressed (about 2.5-fold) in SI carcinoid tumor samples compared to normal mucosa (aP < 0.05) while gastric carcinoids had significantly decreased CTGF compared to SI carcinoid tumors (bP < 0.01). Mean ± SE; B: Correlation analysis of QRT-PCR results in SI EC cell carcinoid tumors. There was a good correlation between CTGF and TGFβ1 transcript levels in tumor samples (R2 = 0.9445, P < 0.01, n = 5).
Figure 2
Figure 2
A: Triple color staining of nuclei (blue-DAPI), CgA (green-Alexa 488) and CTGF (red-Cy5) in a SI carcinoid tumor from the carcinoid TMA. Staining for both CgA and CTGF was cytoplasmic. Dual-stained (CgA + CTGF) cells are yellow. A majority of CgA cells (about 80%) were also CTGF positive (x 400); B: Triple color staining of nuclei, serotonin (green-Alexa 488) and CTGF in a carcinoid tumor from the TMA. Staining for both Serotonin and CTGF was cytoplasmic. Dual-stained (Serotonin + CTGF) cells are yellow. A majority of the serotonin cells (about 95%) were also CTGF positive. (x 600); C: Triple color staining of nuclei (blue-DAPI), cytokeratin (green - Alexa 488) and TGFβ1 (red-Cy5) in a carcinoid tumor from the TMA. Staining for TGFβ1 was cytoplasmic. A majority of the carcinoid tumor cells (cytokeratin-positive) (about 85%) were also TGFβ1 positive (x 200).
Figure 3
Figure 3
Immunostaining of areas of SI carcinoid tumor fibrosis with α-smooth muscle actin (A), vimentin (B), desmin (C), collagen III (D) and CTGF (E/F). Triple color staining of nuclei (blue-DAPI), cytokeratin-carcinoid tumor cells (green-Alexa 488) and the protein of interest (red-Cy5). (A) Discrete α-smooth muscle actin-positive cells (yellow star) were noted interspersed with tumor cells (white star) in areas of fibrosis. Cells consistent with myofibroblasts were associated with vimentin (B), desmin (C), collagen-III (D) and CTGF (E/F) production (yellow arrows). Within the fibrosis, carcinoid tumor cells were also CTGF-positive (F) (white arrow) (400 × magnification).
Figure 4
Figure 4
Micrographs of primary cultured human myofibroblasts isolated from human fibrotic material (SI carcinoid tumor). A: Light microscopy identified the typical stellate shape (black stars) in 5-day cultured cells (200 × magnification); B: Immunostaining with α-smooth muscle actin (Cy-5-red stain; nuclei are blue-DAPI) in same cells after 7-d culture (x 600); C: Message levels of CTGF determined by Q RT-PCR in primary cultured human myofibroblasts. CTGF was significantly over-expressed (about 3-fold) in TGFβ1 (10-7 mol/L, 24 h) stimulated cells compared to control (un-stimulated) cells (aP < 0.05), mean ± SE, n = 3.
Figure 5
Figure 5
AQUA scores for CTGF protein expression in the TMA. Levels in tumors from carcinoid patients with clinically or histologically documented fibrosis (fibrotic SI carcinoid tumors) were significantly higher than tumors from patients with no evidence of fibrosis (non-fibrotic SI carcinoid tumors and gastric carcinoids) and normal mucosa. No differences in expression were noted between either non-fibrotic SI carcinoid tumors or gastric carcinoids and normal mucosa respectively. (aP < 0.05 vs non-fibrotic SI carcinoid tumors, bP < 0.01 vs normal SI mucosa). NS = not significant. mean ± SE.
Figure 6
Figure 6
Serum levels of CTGF in patients with SI EC cell carcinoid tumors, gastric ECL cell carcinoids, other GI carcinoids [hepatic, rectal or appendiceal] and normal controls. Levels (ng/mL) were significantly elevated (> 2-fold versus all other patient groups) in patients with SI EC cell carcinoid tumors compared to the other GI carcinoid tumors. aP < 0.05 vs all other samples. mean ± SE.

References

    1. Modlin IM, Lye KD, Kidd M. A 5-decade analysis of 13,715 carcinoid tumors. Cancer. 2003;97:934–959. - PubMed
    1. Modlin IM, Champaneria MC, Chan AK, Kidd M. A three-decade analysis of 3,911 small intestinal neuroendocrine tumors: the rapid pace of no progress. Am J Gastroenterol. 2007;102:1464–1473. - PubMed
    1. McNeal JE. Mechanism of obstruction in carcinoid tumors of the small intestine. Am J Clin Pathol. 1971;56:452–458. - PubMed
    1. Harvey JN, Denyer ME, DaCosta P. Intestinal infarction caused by carcinoid associated elastic vascular sclerosis: early presentation of a small ileal carcinoid tumour. Gut. 1989;30:691–694. - PMC - PubMed
    1. Levy AD, Rimola J, Mehrotra AK, Sobin LH. From the archives of the AFIP: benign fibrous tumors and tumorlike lesions of the mesentery: radiologic-pathologic correlation. Radiographics. 2006;26:245–264. - PubMed

Publication types

MeSH terms

Substances