. 2007 Sep 18:8:346.
doi: 10.1186/1471-2105-8-346.

A framework for significance analysis of gene expression data using dimension reduction methods

Affiliations

A framework for significance analysis of gene expression data using dimension reduction methods

Lars Gidskehaug et al. BMC Bioinformatics. .

Abstract

Background: The most popular methods for significance analysis on microarray data are well suited to find genes differentially expressed across predefined categories. However, identification of features that correlate with continuous dependent variables is more difficult using these methods, and long lists of significant genes returned are not easily probed for co-regulations and dependencies. Dimension reduction methods are much used in the microarray literature for classification or for obtaining low-dimensional representations of data sets. These methods have an additional interpretation strength that is often not fully exploited when expression data are analysed. In addition, significance analysis may be performed directly on the model parameters to find genes that are important for any number of categorical or continuous responses. We introduce a general scheme for analysis of expression data that combines significance testing with the interpretative advantages of the dimension reduction methods. This approach is applicable both for explorative analysis and for classification and regression problems.

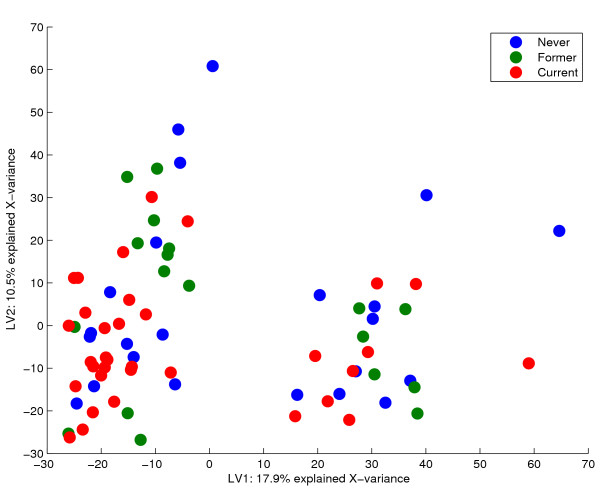
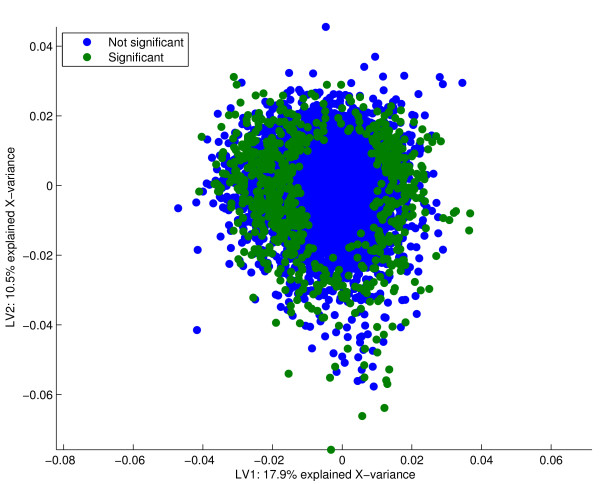
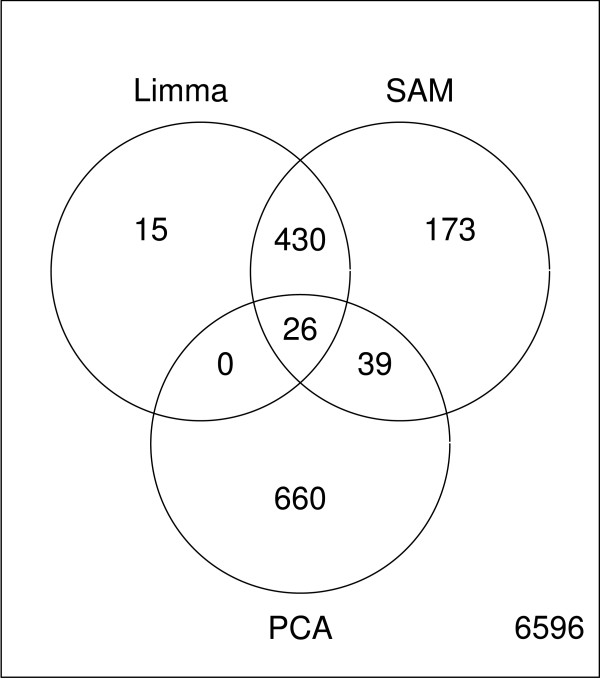
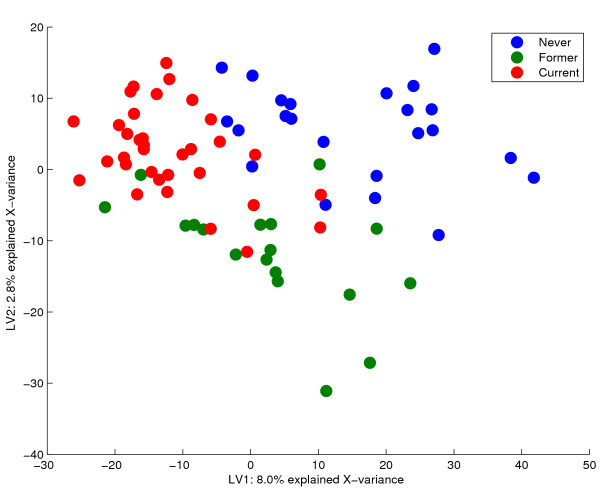
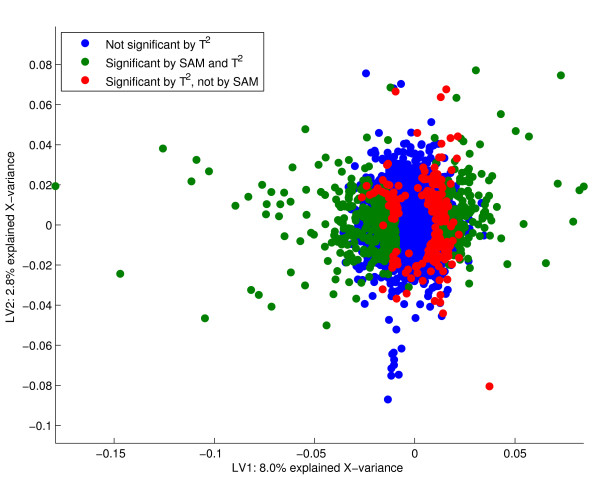
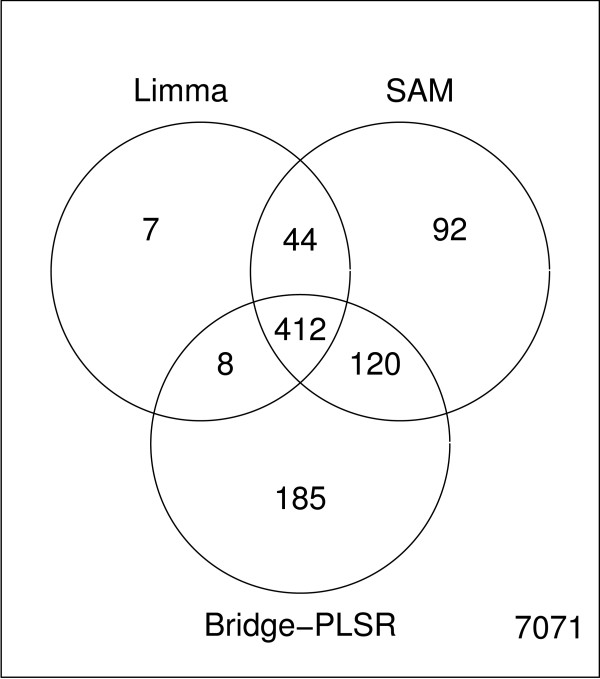
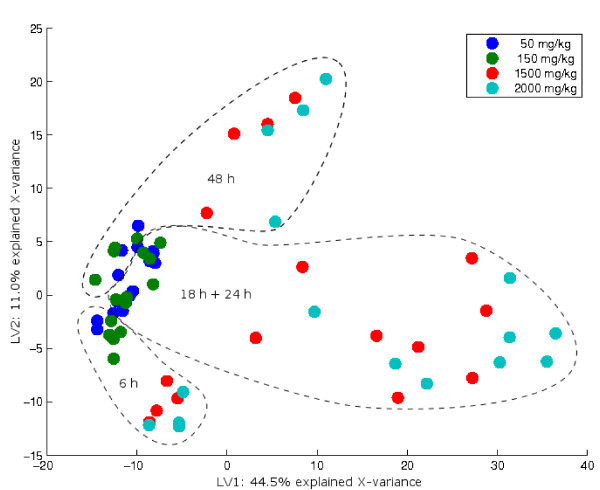
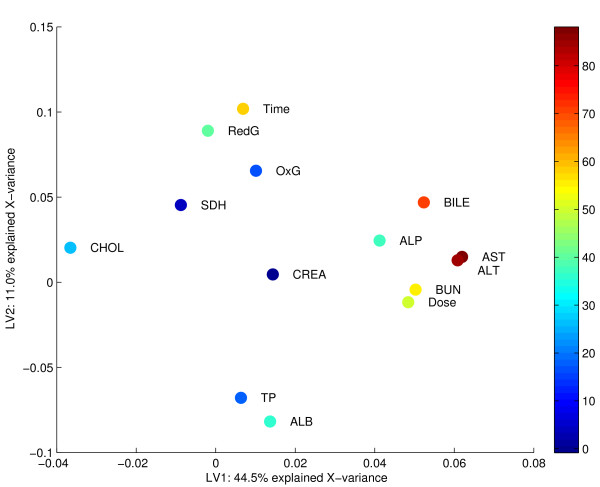
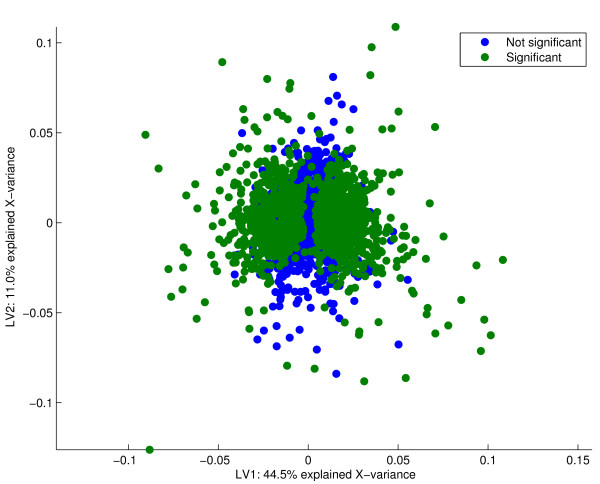
Results: Three public data sets are analysed. One is used for classification, one contains spiked-in transcripts of known concentrations, and one represents a regression problem with several measured responses. Model-based significance analysis is performed using a modified version of Hotelling's T2-test, and a false discovery rate significance level is estimated by resampling. Our results show that underlying biological phenomena and unknown relationships in the data can be detected by a simple visual interpretation of the model parameters. It is also found that measured phenotypic responses may model the expression data more accurately than if the design-parameters are used as input. For the classification data, our method finds much the same genes as the standard methods, in addition to some extra which are shown to be biologically relevant. The list of spiked-in genes is also reproduced with high accuracy.

Conclusion: The dimension reduction methods are versatile tools that may also be used for significance testing. Visual inspection of model components is useful for interpretation, and the methodology is the same whether the goal is classification, prediction of responses, feature selection or exploration of a data set. The presented framework is conceptually and algorithmically simple, and a Matlab toolbox (Mathworks Inc, USA) is supplemented.


Figures

Figure 1
Figure 1
PCA scores. The scores from the PCA of the smoker-data plotted for the two first components. There is a major source of variation along the first component that does not correspond to the smoking history of the test subjects. These components are only able to explain 1% of the variance in Y.
Figure 2
Figure 2
PCA loadings. The loadings from the PCA with the 725 most significant genes given in green. The actual number of significant genes is arbitrary, and corresponds to the number estimated from resampling of a Bridge-PLSR model. It is seen that the significant genes are scattered outside an elliptic shape centred at the origin. Genes with loadings of a large magnitude that vary little in the cross-validation are called significant. As neither of the components span the smoking history of the subjects, these features are irrelevant for classification.
Figure 3
Figure 3
Significant outcomes from PCA. Venn diagram comparing the significant genes from PCA with SAM and Limma. The overlap between the supervised methods and the unsupervised PCA is very small for this data set. This is expected as the principal components do not span the groups of different smoking history.
Figure 4
Figure 4
Bridge-PLSR scores. The two first Bridge-PLSR score-vectors describing the smoker-data are plotted. These components account for 54% of the (calibrated) variance of Y, but only 11% of the X-variance is explained by the model. The first component distinguishes well between current and never smokers, while the second component spans the minute variation that separates former smokers from the rest.
Figure 5
Figure 5
Bridge-PLSR loadings. Loadings from the Bridge-PLSR of the smoker-data are plotted for the two first components. The blue spots represent features that are not found significant by the jack-knife procedure. The green spots are genes that are found significant by both SAM and Bridge-PLSR, while the red spots are called significant by the T2-test but not by SAM. The significant features span mainly the direction of smokers vs. never smokers, but Bridge-PLSR detects some genes relevant for former smokers as well.
Figure 6
Figure 6
Significant outcomes from Bridge-PLSR. A venn diagram comparing the significant genes from Bridge-PLSR with SAM and Limma. At a significance level of 5%, the T2-test finds 725 significant genes, while SAM and Limma find a total of 668 and 471 features, respectively. The majority of the genes are found by all three methods.
Figure 7
Figure 7
Bridge-PLSR scores. The score plot for a two-component Bridge-PLSR model of the rat-liver data. Each array is represented by a spot coloured according to the administered drug-dose. The dashed lines indicate the location of design-points corresponding to different times of exposure. Two groups of high and low dosage can be seen along the first component, and the second component seems to model a time-effect. The two-component model accounts for 47% of the total variance in Y.
Figure 8
Figure 8
Bridge-PLSR Y-loadings. Bridge-PLSR Y-loadings for a two-component model of the rat-liver data. Each point represents an Y-variable, and the percent explained, validated variance for each response is indicated by the colour-bar on the right. The variables are the design parameters Dose and Time, the concentrations of reduced (RedG) and oxidised (OxG) glutathione levels in the liver, and the concentrations in the blood of sorbitol dehydrogenase (SDH), total bile acids (BILE), alkaline phosphatase (ALP), aspartate aminotransferase serum (AST), alanine aminotransferase (ALT), total protein (TP), albumin (ALB), blood urea nitrogen (BUN), creatinine (CREA) and cholesterol (CHOL). The diagnostic markers for liver injury ALT and AST is highly predictive for the first component, while the second component is related to time since exposure.
Figure 9
Figure 9
Bridge-PLSR X-loadings. Bridge-PLSR X-loadings for the rat-liver data. Many significant features are found, and most of them are related to liver damage as described by the first component. Some significant genes are also found that span the time of exposure.

References

    1. Tusher VG, Tibshirani R, Chu G. Significance analysis of microarrays applied to the ionizing radiation response. P Natl Acad Sci USA. 2001;98:5116–5121. - PMC - PubMed
    1. Smyth GK. Limma: linear models for microarray data. In: Gentleman R, Carey V, Dudoit S, Irizarry R, Huber W, editor. Bioinformatics and computational biology solutions using R and Bioconductor. New York, USA: Springer; 2005. pp. 397–420.
    1. Martens H, Martens M. Multivariate analysis of quality: An introduction. Chichester, UK: Wiley; 2001.
    1. Wold S, Esbensen K, Geladi P. Principal component analysis. Chemometr Intell Lab. 1987;2:37–52.
    1. Boulesteix AL, Strimmer K. Partial least squares: a versatile tool for the analysis of high-dimensional genomic data. Brief Bioinformatics. 2007;8:32–44. - PubMed

Publication types

MeSH terms

LinkOut - more resources