

Susceptible-infected-recovered epidemics in dynamic contact networks
- PMID: 17878137
- PMCID: PMC2291166
- DOI: 10.1098/rspb.2007.1159
Susceptible-infected-recovered epidemics in dynamic contact networks
Erratum in
- Proc Biol Sci. 2008 Dec 22;275(1653):2898
Abstract
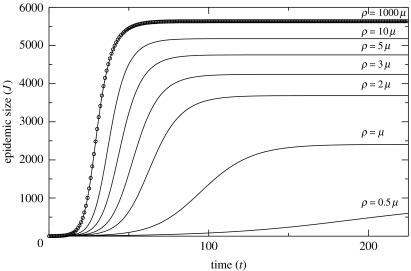
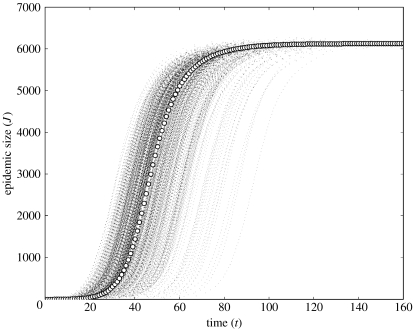
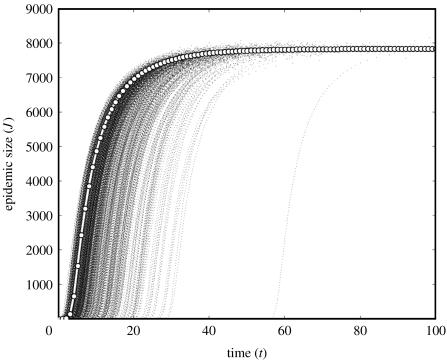
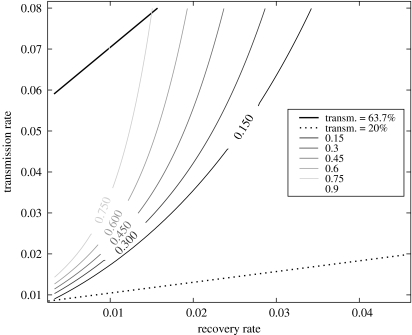
Contact patterns in populations fundamentally influence the spread of infectious diseases. Current mathematical methods for epidemiological forecasting on networks largely assume that contacts between individuals are fixed, at least for the duration of an outbreak. In reality, contact patterns may be quite fluid, with individuals frequently making and breaking social or sexual relationships. Here, we develop a mathematical approach to predicting disease transmission on dynamic networks in which each individual has a characteristic behaviour (typical contact number), but the identities of their contacts change in time. We show that dynamic contact patterns shape epidemiological dynamics in ways that cannot be adequately captured in static network models or mass-action models. Our new model interpolates smoothly between static network models and mass-action models using a mixing parameter, thereby providing a bridge between disparate classes of epidemiological models. Using epidemiological and sexual contact data from an Atlanta high school, we demonstrate the application of this method for forecasting and controlling sexually transmitted disease outbreaks.
Figures
References
-
- Anderson R, May R. Oxford University Press; Oxford, UK: 1991. Infectious diseases of humans: dynamics and control.
-
- Andersson H. Limit theorems for a random graph epidemic model. Ann. Appl. Probab. 1998;8:1331–1349. doi: 10.1214/aoap/1028903384. - DOI
Publication types
MeSH terms
LinkOut - more resources
Full Text Sources
Other Literature Sources
Medical