. 2007 Dec;293(6):E1597-605.
doi: 10.1152/ajpendo.00307.2007. Epub 2007 Sep 18.

Activation by insulin and amino acids of signaling components leading to translation initiation in skeletal muscle of neonatal pigs is developmentally regulated

Affiliations

Activation by insulin and amino acids of signaling components leading to translation initiation in skeletal muscle of neonatal pigs is developmentally regulated

Agus Suryawan et al. Am J Physiol Endocrinol Metab. 2007 Dec.

Abstract

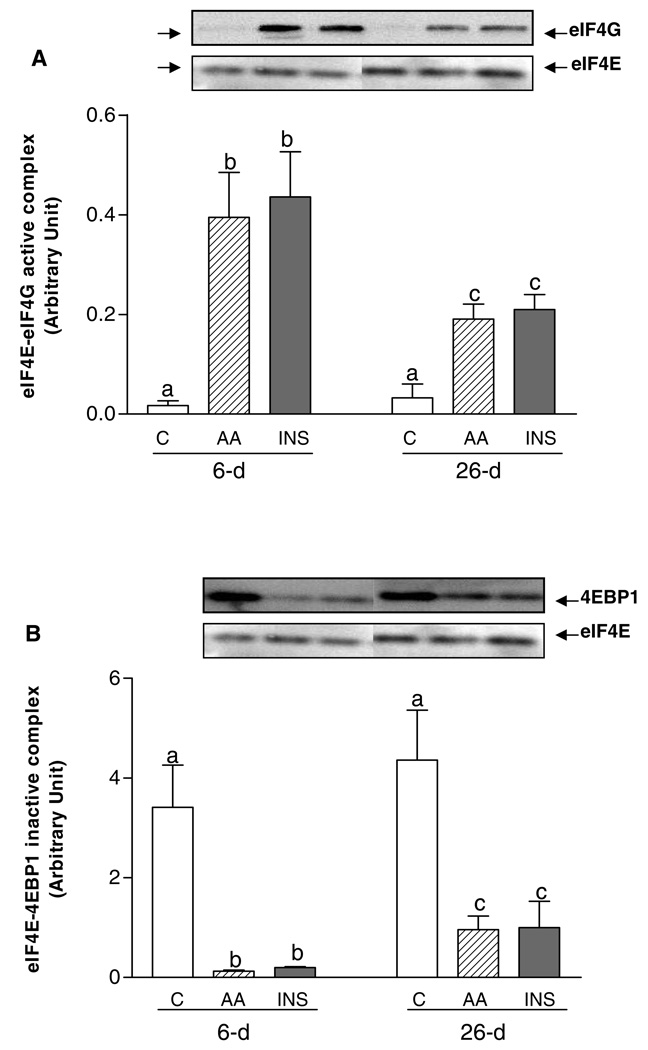
Insulin and amino acids act independently to stimulate protein synthesis in skeletal muscle of neonatal pigs, and the responses decrease with development. The purpose of this study was to compare the separate effects of fed levels of INS and AA on the activation of signaling components leading to translation initiation and how these responses change with development. Overnight-fasted 6- (n = 4/group) and 26-day-old (n = 6/ group) pigs were studied during 1) euinsulinemic-euglycemiceuaminoacidemic conditions (controls), 2) euinsulinemic-euglycemichyperaminoacidemic clamps (AA), and 3) hyperinsulinemic-euglycemic-euaminoacidemic clamps (INS). INS, but not AA, increased the phosphorylation of protein kinase B (PKB) and tuberous sclerosis 2 (TSC2). Both INS and AA increased protein synthesis and the phosphorylation of mammalian target of rapamycin (mTOR), ribosomal protein S6 kinase-1, and eukaryotic initiation factor (eIF)4E-binding protein 1 (4E-BP1), and these responses were higher in 6-day-old compared with 26-day-old pigs. Both INS and AA decreased the binding of 4E-BP1 to eIF4E and increased eIF4E binding to eIF4G; these effects were greater in 6-day-old than in 26-day-old pigs. Neither INS nor AA altered the composition of mTORC1 (raptor, mTOR, and GbetaL) or mTORC2 (rictor, mTOR, and GbetaL) complexes. Furthermore, neither INS, AA, nor age had any effect on the abundance of Rheb and the phosphorylation of AMP-activated protein kinase and eukaryotic elongation factor 2. Our results suggest that the activation by insulin and amino acids of signaling components leading to translation initiation is developmentally regulated and parallels the developmental decline in protein synthesis in skeletal muscle of neonatal pigs.


Figures

Figure 1
Figure 1
Fractional rates of protein synthesis (A) and the phosphorylation of PKB at Ser 473 (B) in longissimus dorsi muscle of 6- and 26-day-old pigs in response to euinsulinemic-euglycemic-euaminoacidemic conditions (C), euinsulinemic-euglycemic-hyperaminoacidemic clamps (AA), and hyperinsulinemic-euglycemic-euaminoacidemic clamps (INS). Values of the phosphorylation of PKB were normalized for PKB content in samples. Values are means ± SEM; n = 4–6 per treatments. Means with different letters differ at P < 0.05.
Figure 2
Figure 2
The phosphorylation of AMPK at Thr 172 (A), the phosphorylation of TSC2 at Thr 1462 (B), and the abundance of Rheb (C) in longissimus dorsi muscle of 6- and 26-day-old pigs in response to euinsulinemic-euglycemic-euaminoacidemic conditions (C), euinsulinemic-euglycemic-hyperaminoacidemic clamps (AA), and hyperinsulinemic-euglycemic-euaminoacidemic clamps (INS). Values of the phosphorylation of AMPK or TSC2 were normalized for AMPK or TSC2 content in samples. Values are means ± SEM; n = 4–6 per treatments. Means with different letters differ at P < 0.05.
Figure 3
Figure 3
The raptor-mTOR association (A), the GβL-mTOR association (B), and the rictor-mTOR association (C) in longissimus dorsi muscle of 6- and 26-day-old pigs in response to euinsulinemic-euglycemic-euaminoacidemic conditions (C), euinsulinemic-euglycemic-hyperaminoacidemic clamps (AA), and hyperinsulinemic-euglycemic-euaminoacidemic clamps (INS). Values of all complexes were normalized for mTOR content in the immunoprecipitant (the amounts of mTOR in the immunoprecipitant were similar in both ages). Values are means ± SEM; n = 4–6 per treatments. Means with different letters differ at P < 0.05.
Figure 4
Figure 4
The phosphorylation of mTOR at Ser 2448 (A), the phosphorylation of S6K1 at Thr 389 (B) and the phosphorylation of 4E-BP1 at Thr 70 in longissimus dorsi muscle of 6- and 26-day-old pigs in response to euinsulinemic-euglycemic-euaminoacidemic conditions (C), euinsulinemic-euglycemic-hyperaminoacidemic clamps (AA), and hyperinsulinemic-euglycemic-euaminoacidemic clamps (INS). Values of the phosphorylation of mTOR or S6K1 or 4E-BP1 were normalized for mTOR, S6K1, or 4E-BP1 content in samples. Values are means ± SEM; n = 4–6 per treatments. Means with different letters differ at P < 0.05.
Figure 5
Figure 5
The formation of an active complex of eIF4E-eIF4G (A) and the formation of an inactive complex of eIF4E-4EBP1 in longissimus dorsi muscle of 6- and 26-day-old pigs in response to euinsulinemic-euglycemic-euaminoacidemic conditions (C), euinsulinemic-euglycemic-hyperaminoacidemic clamps (AA), and hyperinsulinemic-euglycemic-euaminoacidemic clamps (INS). Values of both complexes were normalized for eIF4E content in the immunoprecipitant (the amounts of eIF4E in the immunoprecipitant were similar in both ages). Values are means ± SEM; n = 4–6 per treatments. Means with different letters differ at P < 0.05.
Figure 6
Figure 6
The phosphorylation of eEF2 at Thr 56 in longissimus dorsi muscle of 6- and 26-day-old pigs in response to euinsulinemic-euglycemic-euaminoacidemic conditions (C), euinsulinemic-euglycemic-hyperaminoacidemic clamps (AA), and hyperinsulinemic-euglycemic-euaminoacidemic clamps (INS). Values of the phosphorylation of eEF2 were normalized for eEF2 content in samples. Values are means ± SEM; n = 4–6 per treatments. Means with different letters differ at P < 0.05.

Similar articles

Cited by

References

    1. Asnaghi L, Bruno P, Priulla M, Nicolin A. mTOR: a protein kinase switching between life and death. Pharmacol Res. 2004;50:545–549. - PubMed
    1. Avruch J, Hara K, Lin Y, Liu M, Long X, Ortiz-Vega S, Yonezawa K. Insulin and amino-acid regulation of mTOR signaling and kinase activity through the Rheb GTPase. Oncogene. 2006;25:6361–6372. - PubMed
    1. Avruch J, Lin Y, Long X, Murthy S, Ortiz-Vega S. Recent advances in the regulation of the TOR pathway by insulin and amino acids. Curr Opin Clin Nutr Metab Care. 2005;8:67–72. - PubMed
    1. Bevan P. Insulin signalling. J Cell Sci. 2001;114:1429–1430. - PubMed
    1. Carling D. AMP-activated protein kinase: balancing the scales. Biochimie. 2005;87:87–91. - PubMed

Publication types

MeSH terms