. 2007 Oct 15;120(Pt 20):3509-21.
doi: 10.1242/jcs.006916. Epub 2007 Sep 18.

Cholesterol suppresses cellular TGF-beta responsiveness: implications in atherogenesis

Affiliations

Cholesterol suppresses cellular TGF-beta responsiveness: implications in atherogenesis

Chun-Lin Chen et al. J Cell Sci. .

Abstract

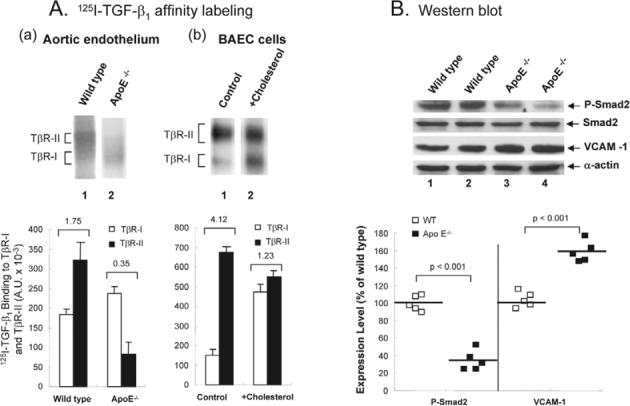
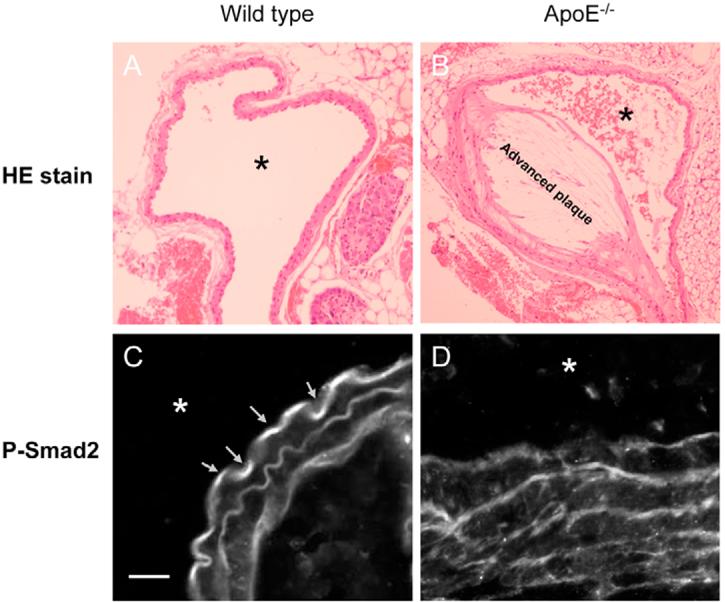
Hypercholesterolemia is a major causative factor for atherosclerotic cardiovascular disease. The molecular mechanisms by which cholesterol initiates and facilitates the process of atherosclerosis are not well understood. Here, we demonstrate that cholesterol treatment suppresses or attenuates TGF-beta responsiveness in all cell types studied as determined by measuring TGF-beta-induced Smad2 phosphorylation and nuclear translocation, TGF-beta-induced PAI-1 expression, TGF-beta-induced luciferase reporter gene expression and TGF-beta-induced growth inhibition. Cholesterol, alone or complexed in lipoproteins (LDL, VLDL), suppresses TGF-beta responsiveness by increasing lipid raft and/or caveolae accumulation of TGF-beta receptors and facilitating rapid degradation of TGF-beta and thus suppressing TGF-beta-induced signaling. Conversely, cholesterol-lowering agents (fluvastatin and lovastatin) and cholesterol-depleting agents (beta-cyclodextrin and nystatin) enhance TGF-beta responsiveness by increasing non-lipid raft microdomain accumulation of TGF-beta receptors and facilitating TGF-beta-induced signaling. Furthermore, the effects of cholesterol on the cultured cells are also found in the aortic endothelium of ApoE-null mice fed a high-cholesterol diet. These results suggest that high cholesterol contributes to atherogenesis, at least in part, by suppressing TGF-beta responsiveness in vascular cells.


Figures

Fig. 1
Fig. 1
Effects of cholesterol and LDL on Smad2 phosphorylation (A-C) and nuclear translocations (D) in Mv1Lu cells and BAECs stimulated with TGF-β1. Cells were treated with increasing concentrations of cholesterol, as indicated (A,B), 50 μg protein/ml LDL (C), 5 μg protein/ml VLDL (C) or 50 μg/ml cholesterol (D) at 37°C for 1 hour and then further incubated with 50 pM TGF-β1 for 30 minutes. P-Smad2 and total Smad2 in the cell lysates were analyzed by immunoblotting. The relative level of P-Smad2 (P-Smad2/Smad2) was estimated. A representative of a total of three analyses is shown (top). The quantitative analysis of the immunoblots is shown below. The relative level of P-Smad2 in cells treated with TGF-β1 only was taken as 100% of TGF-β1-stimulated Smad2 phosphorylation. The data are mean ± s.d. *,**Significantly lower than that in cells treated with TGF-β1 only: P<0.001 and P<0.05, respectively. (D) Smad2 nuclear translocation was analyzed by indirect immunofluorescent staining. Rhodamine fluorescence represents P-Smad2 staining (a-c) whereas the nuclei were stained by DAPI staining (d-f).
Fig. 2
Fig. 2
Effects of cholesterol, LDL, statins, β-CD and nystatin on TGF-β1-induced PAI-1 expression in Mv1Lu cells (A,C,E,F,G,H) and BAECs (B,D). Cells were treated with increasing concentrations of cholesterol as indicated (A,B), 50 μg/ml cholesterol (C,D,E), 50 μg/ml LDL (E), β-CD (0.5%; H) or nystatin (25 μg/ml; H) at 37°C for 1 hour or with 1 μM fluvastatin or lovastatin (F,G) or with different concentrations of fluvastatin (G) at 37°C for 16 hours and then further incubated with increasing concentrations (as indicated) of TGF-β1 (C,D) or 50 pM TGF-β1 (A,B,E,G,H) for 2 hours. Northern blot analyses of PAI-1 and G3PDH were performed and a representative of a total of three analyses per experiment is shown (a). The relative amounts of the transcripts (PAI-1 and G3PDH) were quantified with a PhosphoImager. The ratio of the relative amounts of PAI-1 and G3PDH transcripts in cells treated without TGF-β1 and cholesterol, LDL or statins on the blot was taken as 1 fold or 100% of PAI-1 expression. The quantitative data from three independent analyses was shown (b). The data are mean ± s.d. *Significantly lower than that of control P<0.001.
Fig. 3
Fig. 3
Effects of cholesterol and lovastatin on the TGF-β1-stimulated luciferase activity (A) and TGF-β1-induced growth inhibition (B) in Mv1Lu cells. (A) Cells stably expressing a luciferase reporter gene were treated with increasing concentrations (as indicated) of cholesterol at 37°C for 1 hour (a) or with 1 μM lovastatin at 37°C for 16 hours ± cholesterol (20 μg/ml) at 37°C for 1 hour (b) and then further incubated with 50 pM TGF-β1 for 6 hours. The luciferase activity of the cell lysates (20 μg protein) was determined and expressed as arbitrary units (A.U.). The luciferase activity in cells treated with TGF-β1 only was taken as 100% (a). The data was obtained from three or four independent analyses. *Significantly lower or higher than that in cells treated with TGF-β1 only: P<0.001. (B) Cells were incubated with 0.0625 and 0.125 pM TGF-β1 in the presence of increasing concentrations of cholesterol, as indicated. Cell growth was then determined by measurement of [3H-methyl]thymidine incorporation into cellular DNA. The [3H-methyl]thymidine incorporation in cells treated with vehicle only was taken as 100%. TGF-β1 at 0.0625 and 0.125 pM inhibited DNA synthesis by ∼30% and ∼40%, respectively. The degree (%) of cholesterol-mediated reversal of TGF-β1 growth inhibition was estimated by the equation: % reversal=[1–(T1–T2/T3–T4)]×100, where T1 is the thymidine incorporation in cells treated with cholesterol alone; T2, the thymidine incorporation in cells treated with cholesterol plus TGF-β1; T3, the thymidine incorporation in cells treated with vehicle only and T4, the thymidine incorporation in cells treated with TGF-β1 alone. The experiments were carried out in triplicate.
Fig. 4
Fig. 4
Sucrose density gradient analysis of TβR-II in the plasma membrane of Mv1Lu cells treated with or without cholesterol and stimulated with and without TGF-β1. Cells were treated with or without 50 μg/ml cholesterol at 37°C for 1 hour and further incubated with and without 50 pM TGF-β1 for 2 hours. The cell lysates from these treated cells were subjected to sucrose density gradient ultracentrifugation. The sucrose gradient fractions were then analyzed by western blot analysis using anti-TβR-I, anti-TβR-II, anti-TfR-1 and anti-caveolin-1 antibodies. The arrow indicates the locations of TβR-I, TβR-II, caveolin-1 and TfR-1. Fractions 4 and 5 contained lipid rafts/caveolae whereas fractions 7 and 8 are non-lipid raft fractions. Treatment with cholesterol alone did not affect the total amounts of TGF-β receptor proteins and cell proteins. Open arrowheads indicate the increased amount of TβR-I or TβR-II in the fraction as compared with that of untreated control. *The decreased amount of TβR-II in the fraction as compared with that of untreated control. #The decreased amount of TβR-II in the fraction as compared with that of treatment with cholesterol or TGF-β1 alone.
Fig. 5
Fig. 5
Immunofluorescent localization of TβR-I and caveolin-1 in Mv1Lu cells treated with and without cholesterol and TGF-β1. Cells were treated with or without 50 μg/ml cholesterol at 37°C for 1 hour and incubated with and without 100 pM TGF-β1 at 37°C for 30 minutes. The cells were then fixed with cold methanol and incubated with a goat antibody to TβR-I (e-h) and rabbit antibody to caveolin-1 (a-d) followed by incubation with Rhodamine-conjugated donkey anti-goat antibody or FITC-conjugated mouse anti-rabbit antibody. The fluorescence in cells was examined using a fluorescent confocal microscope. Bar, 20 μm. The arrows indicate colocalization of TβR-I and caveolin-1 at the cell surface (j).
Fig. 6
Fig. 6
Concentration dependence of cholesterol (A) or LDL (B) in enhancing TGF-β1-induced degradation of TβR-II in Mv1Lu cells. Cells were treated with several concentrations of cholesterol (A) or LDL (B), as indicated, at 37°C for 1 hour, then incubated with and without 1% β-CD at 37°C for 1 hour and further incubated with 50 pM TGF-β for 2 hours. The cell lysates were then subjected to western blot analysis using anti-TβR-II and anti-α-actin antibodies (a) and quantification by densitometry (b). The ratio of the relative amounts of TβR-II and α-actin in cells treated without TGF-β1 was taken as the 100% level of TβR-II. The data are representative of a total of three independent analyses; values are mean ± s.d. *Significantly lower than control cells: P<0.001.
Fig. 7
Fig. 7
Effects of the treatments with lovastatin, fluvastatin and nystatin on the plasma-membrane microdomain localization (A) and TGF-β1-induced degradation of TβR-II (B) in Mv1Lu cells. Cells were treated with or without lovastatin (1 μM), fluvastatin (1 μM) or nystatin (25 μg/ml) at 37°C for 16 hours or 1 hour, respectively. The treated cells were directly analyzed by sucrose density gradient ultracentrifugation analysis (A) or further incubated with 50 pM TGF-β at 37°C for several time periods as indicated (B). Western blot analyses of the sucrose density gradient fractions (A) and of TGF-β1-treated cell lysates (B) were performed using anti-TβR-II, anti-caveolin-1, anti-TfR-1 and anti-α-actin antibodies. The open arrowheads indicate the increased amount of TβR-II in the fraction as compared with that of the untreated control. The data are representative of a total of three independent analyses; values are mean ± s.d. *Significantly higher than that in cells treated without fluvastatin: P<0.05.
Fig. 8
Fig. 8
A lower ratio of 125I-TGF-β1 binding to TβR-II and TβR-I (A) and suppressed TGF-β responsiveness (B) in the aortic endothelium of ApoE-null mice fed a high-cholesterol diet and in cultured BAECs treated with cholesterol. (A) 125I-TGF-β affinity labeling. (a) The aortic endothelium from wild-type and ApoE-null (ApoE−/−) mice fed a high-cholesterol diet (lanes 1 and 2, respectively) and BAECs treated with and without 50 μg/ml cholesterol at 37°C for 1 hour, were affinity-labeled with 125I-TGF-β1, extracted with 1% Triton X-100, analyzed by 7.5% SDS-PAGE and autoradiography (top), and quantified using a PhosphoImager (bottom). A representative of a total of five animals each analyzed or of three independent BAEC analyses is shown. The number on the top of the bar charts is the estimated ratio of 125I-TGF-β1 binding to TβR-II and TβR-I. (B) Western blot analysis. The aortic endothelium from wild-type (top, lanes 1 and 2) and ApoE-null mice (ApoE−/−) (top, lanes 3 and 4) mice fed a high-cholesterol diet were extracted with 1% Triton X-100. Equal protein amounts (∼100 μg) of the Triton X-100 extracts were then subjected to western blot analysis using antibodies to Smad2, P-Smad2, VCAM-1 and α-actin (top). Two representatives (lanes 1 and 2, and 3 and 4) of a total of five animals each analyzed are shown (top). The relative levels of P-Smad2 (P-Smad2/Smad2) and VCAM-1 (VCAM-1/α-actin) were estimated (bottom). Statistical comparisons between groups were made by use of the Mann-Whitney test (bottom). Data represent median (interquartile). *P<0.001 versus wild-type mice.
Fig. 9
Fig. 9
Immunofluorescent localization of P-Smad2 in the coronary artery from wild-type and ApoE-null mice fed a high cholesterol diet. (A,B) Representative photographs of the coronary artery from wild-type (A) mice exhibited a plaque-free section; that from ApoE-null mice fed a high cholesterol diet (B) showed an advanced plaque. (C,D) Immunofluorescent confocal microscopic analysis of the tissue cross sections revealed that P-Smad2 is present in wild-type mice (C) whereas no P-Smad2 was detected in the endothelium of the coronary artery from ApoE-null mice fed a high cholesterol diet (D). *The location of the artery lumen. The magnification is 200× (A and B); bar, 20 μm (C,D). The arrows in C indicate the localization of P-Smad2 in the artery endothelium.
Fig. 10
Fig. 10
A model for the cholesterol effect on TGF-β partitioning between lipid rafts/caveolae- and clathrin-mediated endocytosis. In cells, there are two major TβR-I–TβR-II complexes (Complex I and Complex II) present on the cell face. Complex I and Complex II are mainly localized in the non-lipid raft and lipid raft/caveolae microdomains of the plasma membrane, respectively. The numbers of TβR-I and TβR-II molecules (blue rectangles) in Complex I and Complex II shown in the model are arbitrary and intended to indicate that Complex I and Complex II contain TβR-II>TβR-I and TβR-I>TβR-II, respectively. The ratio of TβR-II to TβR-I can be determined by 125I-TGF-β1 affinity labeling (Chen et al., 2006). Cholesterol increases the formation and/or stabilization of lipid rafts/caveolae by integration into the plasma membrane, thereby increasing the localization of TβR-I and TβR-II in lipid rafts/caveolae (as Complex II), facilitating rapid degradation of TGF-β and attenuating TGF-β responsiveness (Smad dependent). Complex II may also be capable of mediating Smad2/3-indepentent signaling which leads to different cellular responsiveness such as fibrogenesis in fibroblasts (Pannu et al., 2007). Depletion of cholesterol in the plasma membrane, by treating cells with cholesterol-lowering agents (e.g. statins) or cholesterol-depleting agents (e.g. β-CD), facilitates the localization of TβR-I and TβR-II in non-lipid raft microdomains. In the presence of ligand, Complex I undergoes clathrin-mediated endocytosis, promoting Smad2/3-dependent endosomal signaling and TGF-β responsiveness. In hypercholesterolemic mice, cell-surface TGF-β receptor complexes in the aortic endothelium contain more Complex II than Complex I. In normal mice, cell-surface TGF-β receptor complexes contain more Complex I than Complex II in the aortic endothelium.

References

    1. Abe M, Harpel JG, Metz CN, Nunes I, Loskutoff DJ, Rifkin DB. An essay for transforming growth factor-β using cells transfected with a plasminogen activator inhibitor-1 promoter-luciferase construct. Anal. Biochem. 1994;216:276–284. - PubMed
    1. Alberts AW. Discovery, biochemistry and biology of lovastatin. Am. J. Cardiol. 1988;62:11. - PubMed
    1. Bickel PE. Lipid rafts and insulin signaling. Am. J. Physiol. Endocrinol. Metab. 2002;282:E1–E10. - PubMed
    1. Brown MS, Goldstein JL. Lowering LDL – not only how low, but how long? Science. 2006;311:1721–1723. - PubMed
    1. Buchwald H. Cholesterol inhibition, cancer, and chemotherapy. Lancet. 1992;339:1154–1156. - PubMed

Publication types

MeSH terms

Substances