. 2007 Sep 25;104(39):15317-22.
doi: 10.1073/pnas.0706251104. Epub 2007 Sep 18.

Anatomy of energetic changes accompanying urea-induced protein denaturation

Affiliations

Anatomy of energetic changes accompanying urea-induced protein denaturation

Matthew Auton et al. Proc Natl Acad Sci U S A. .

Abstract

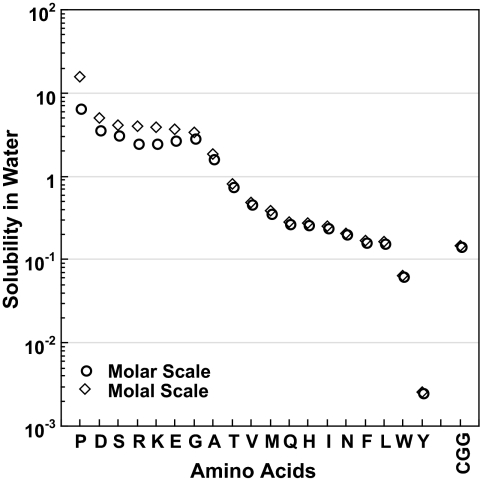
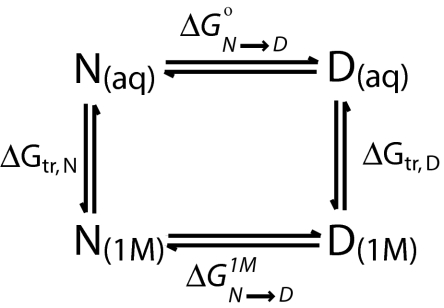
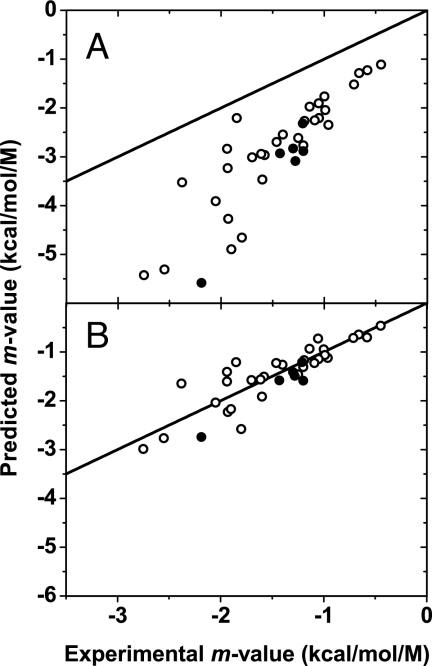
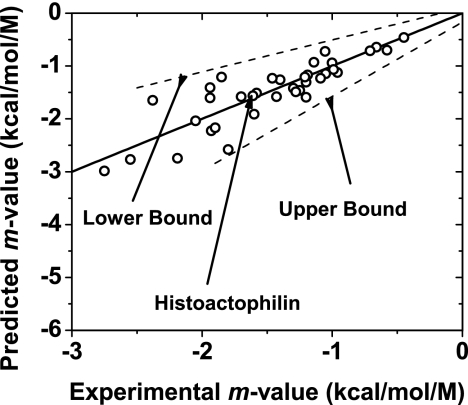
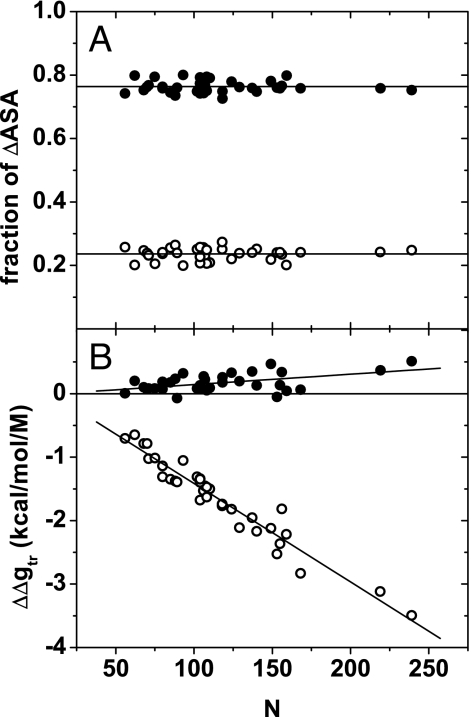
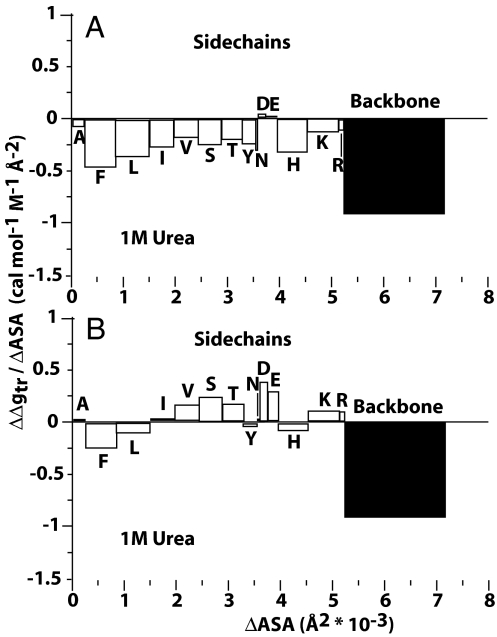
Because of its protein-denaturing ability, urea has played a pivotal role in the experimental and conceptual understanding of protein folding and unfolding. The measure of urea's ability to force a protein to unfold is given by the m value, an experimental quantity giving the free energy change for unfolding per molar urea. With the aid of Tanford's transfer model [Tanford C (1964) J Am Chem Soc 86:2050-2059], we use newly obtained group transfer free energies (GTFEs) of protein side-chain and backbone units from water to 1 M urea to account for the m value of urea, and the method reveals the anatomy of protein denaturation in terms of residue-level free energy contributions of groups newly exposed on denaturation. The GTFEs were obtained by accounting for solubility and activity coefficient ratios accompanying the transfer of glycine from water to 1 M urea. Contrary to the opinions of some researchers, the GTFEs show that urea does not denature proteins through favorable interactions with nonpolar side chains; what drives urea-induced protein unfolding is the large favorable interaction of urea with the peptide backbone. Although the m value is said to be proportional to surface area newly exposed on denaturation, only approximately 25% of the area favorably contributes to unfolding (because of newly exposed backbone units), with approximately 75% modestly opposing urea-induced denaturation (originating from side-chain exposure). Use of the transfer model and newly determined GTFEs achieves the long-sought goal of predicting urea-dependent cooperative protein unfolding energetics at the level of individual amino acid residues.


Conflict of interest statement

The authors declare no conflict of interest.

Figures

Fig. 1.
Fig. 1.
The solubility of amino acids in water in the molar (○) and molal (◇) concentration scales are ranked from greatest (proline) to least (tyrosine) according to molal solubility. The solubility of the peptide backbone model compound, cyclic glycylglycine (CGG), is included on the far right.
Scheme 1.
Scheme 1.
The transfer model
Fig. 2.
Fig. 2.
Predicted versus experimentally determined m values. The proteins represented are listed in the SI Appendix. Disulfide-containing proteins are represented as filled circles. The identity line is shown for comparison. Predicted m values were obtained by using GTFEtr,iapp values (A) and the corrected GTFE*tr,i values (B) as explained in the text.
Fig. 3.
Fig. 3.
Predicted m values based on GTFE*tr,i values versus experimentally determined m values. The dashed lines indicated give linear fits of the lower- and upper-bound calculated m values. The solid line is the identity line for predicted and experimental m values. The position of histoactophilin, the protein example used in Fig. 5, is shown for reference.
Fig. 4.
Fig. 4.
Fractional surface areas and m value contributions of groups newly exposed on unfolding. (A) Fractions of ΔASA, in which ASA is solvent-accessible surface area, contributed by groups newly exposed on unfolding are shown as a function of protein size (number of residues). The lines represent the average value for side chains and backbones. (B) m value contributions of side chains and backbone units (ΔΔgtr) versus number of residues. The slopes of the fitted lines are (1.6 ± 0.5) × 10−3 for the side chains and (−15.5 ± 0.7) × 10−3 for the backbones. For both A and B, the values for the side chains are shown as filled circles and for the backbone as open circles.
Fig. 5.
Fig. 5.
Side-chain and backbone m value contributions (ΔΔgtr) divided by their respective contribution to ΔASA (cal·mol−1·M−1·Å−2) as a function of total surface area newly exposed on denaturation of histoactophilin. Open bars are for side chains, and black bars are for peptide backbone units. The contributions were calculated by using GTFEtr,iapp (A) and GTFE*tr,i (B).

References

    1. Nozaki Y, Tanford C. J Biol Chem. 1963;238:4074–4081. - PubMed
    1. Tanford C. J Am Chem Soc. 1964;86:2050–2059.
    1. Tanford C. Adv Protein Chem. 1970;24:1–95. - PubMed
    1. Wang A, Bolen DW. Biochemistry. 1997;36:9101–9108. - PubMed
    1. Kauzmann W. Adv Protein Chem. 1959;14:1–63. - PubMed

Publication types

LinkOut - more resources