. 2007 Sep 19;2(9):e895.
doi: 10.1371/journal.pone.0000895.

DNA methylation in the human cerebral cortex is dynamically regulated throughout the life span and involves differentiated neurons

Affiliations

DNA methylation in the human cerebral cortex is dynamically regulated throughout the life span and involves differentiated neurons

Kimberly D Siegmund et al. PLoS One. .

Abstract

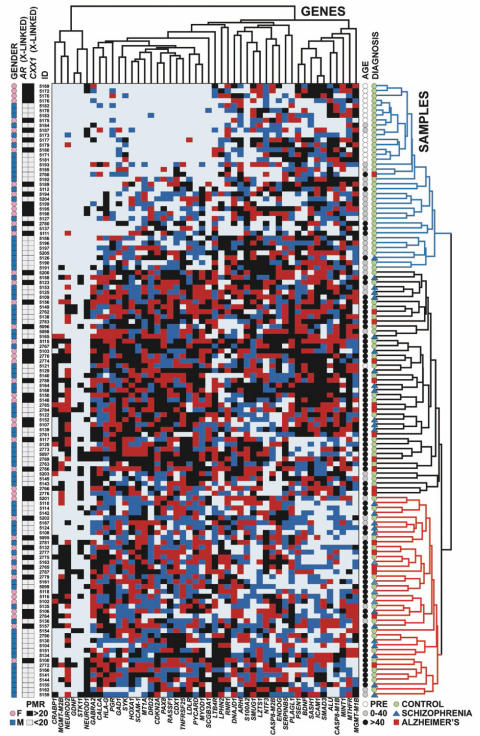
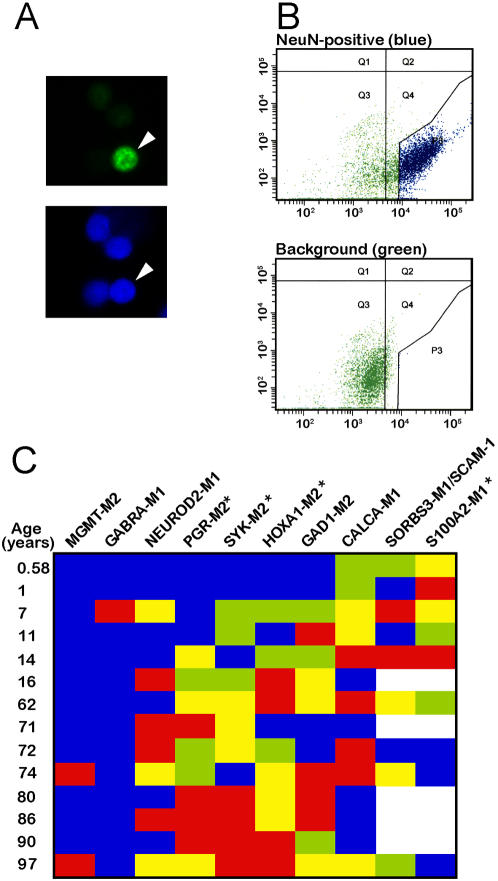
The role of DNA cytosine methylation, an epigenetic regulator of chromatin structure and function, during normal and pathological brain development and aging remains unclear. Here, we examined by MethyLight PCR the DNA methylation status at 50 loci, encompassing primarily 5' CpG islands of genes related to CNS growth and development, in temporal neocortex of 125 subjects ranging in age from 17 weeks of gestation to 104 years old. Two psychiatric disease cohorts--defined by chronic neurodegeneration (Alzheimer's) or lack thereof (schizophrenia)--were included. A robust and progressive rise in DNA methylation levels across the lifespan was observed for 8/50 loci (GABRA2, GAD1, HOXA1, NEUROD1, NEUROD2, PGR, STK11, SYK) typically in conjunction with declining levels of the corresponding mRNAs. Another 16 loci were defined by a sharp rise in DNA methylation levels within the first few months or years after birth. Disease-associated changes were limited to 2/50 loci in the Alzheimer's cohort, which appeared to reflect an acceleration of the age-related change in normal brain. Additionally, methylation studies on sorted nuclei provided evidence for bidirectional methylation events in cortical neurons during the transition from childhood to advanced age, as reflected by significant increases at 3, and a decrease at 1 of 10 loci. Furthermore, the DNMT3a de novo DNA methyl-transferase was expressed across all ages, including a subset of neurons residing in layers III and V of the mature cortex. Therefore, DNA methylation is dynamically regulated in the human cerebral cortex throughout the lifespan, involves differentiated neurons, and affects a substantial portion of genes predominantly by an age-related increase.


Conflict of interest statement

Competing Interests: The authors have declared that no competing interests exist.

Figures

Figure 1
Figure 1. DNA methylation changes at 50 loci in temporal neocortex across the lifespan.
Two dimensional hierarchical cluster analysis using Manhattan distance and average linkage (N = 48 regions, 125 subjects). DNA (rostro-lateral temporal neocortex) was extracted and analyzed by MethyLight for the genes indicted as described (see Methods). Each gene is grouped into quartiles (Dark Light Blue = 1 low, Dark Blue = 2 medium-low, Red = 3 medium high, Black = 4 high extent of methylation). The larger the number of samples with no detectable methylation, the fewer the number of observations coded dark blue and red. Gender (Blue squares = Male, Pink circles = Female), Age (White circles = Prenatal (PRE); Gray circles = 0–40 years old; Black circles = older than 40 years), and Diagnosis (Green circles = controls; Blue triangles = Schizophrenia cases; Red squares = Alzheimer's cases) are indicated with symbols explained below each variable. AR and FAM127A are two additional X-linked genes with DNA methylation occurring on the inactive X-chromosome in females, and are dichotomized at a PMR value of 20, as indicated. PMR = Percent of Methylated Reference , . Three major sample clusters are indicated on the right hand side in blue (consisting mostly of prenatal and young adult samples), black, consisting mostly of subjects over 40 years old with high density CpG island methylation, and red, mostly subjects over 40 years old with lower density CpG island methylation.
Figure 2
Figure 2. Four developmental profiles for cortical DNA methylation.
(A) Associations of log-transformed PMR values (ln(PMR+1); y-axis) with age (x-axis) for several representative genes. Trends are studied using linear regression. HOXA1 shows a linear association. MGMT-M2B shows a non-linear shift, with the P-value referring to a T-test of the difference in mean methylation value for subjects under or over 50 years of age. For the biphasic linear trends of PAX8 and the ALU sequence ALU-M1B (Table S2) , the P-values refer to a test of change of slope. Green dots = controls, blue triangles = schizophrenia and red squares = Alzheimer's subjects. (B) Schematic summary of the four different types (1–4, see text for details) of developmental methylation profiles in human temporal cortex across the lifespan (x-axis, B = birth), as illustrated by the representative examples in (A). (C) Listings and proportion of gene loci (total = 48; excluding AR and FAM127A which showed gender-specific methylation) that show significant age-dependent methylation changes: colors refer to the scheme in (B). Gray sector refers to the subset of loci without a significant age effect. N = 125 subjects. All p-values are adjusted for diagnosis; *** p<0.0001, ** p<0.001, * p<0.05.
Figure 3
Figure 3. Acceleration of age-associated DNA methylation changes in Alzheimer's disease.
Scatter plots showing age-associated methylation changes for SORBS3 and S100A2 across all ages. N = 125 subjects, including Alzheimer subjects (red squares), schizophrenics (blue triangles) and controls (green dots). P-values refer to T-tests for comparison of Alzheimer subjects versus all other subjects older than 60 years. One outlier (ID 2763, 104 years old, Table S4) was omitted from the age-associated analyses.
Figure 4
Figure 4. Developmental and cellular expression pattern of DNMT3a in the cerebral cortex.
(A) Representative immunoblotting of temporal cortex homogenates with anti-DNMT3a antibody (top) and β-actin as loading control (bottom). Left, fetal samples (gw = gestational week); right, child and adult brains (yrs = years) and, as positive control, murine embryonic carcinoma, “P19” cells. Notice expression of DNMT3a—indicated by a ∼120 kDa band—across all ages. (B, C) Digitized images of temporal cortex nuclei from 1 year old infant, processed for DNMT3a (red) and NeuN (green) immunoreactivity and counterstained with DAPI. Notice numerous neuronal nuclei expressing both markers, including representative example marked by arrowhead. Occasional non-neuronal DNMT3a+ nucleus is marked by arrow. (D,E) show weak background staining and formalin fixation-related autofluorescence in negative controls processed without primary antibodies. (F–H) Images from layers III, IV and V of parallel sections from adult temporal cortex, stained for Nissl (F) or hybridized with digoxigenin-labeled DNMT3a antisense (G) or sense riboprobe (H). Notice in (G) robust expression of DNMT3a mRNA in a subset of layer III and V neurons. Images in B–E taken at with 20× objective. Bar (F–H) in H = 100 µm.
Figure 5
Figure 5. Age-related DNA methylation changes in differentiated neurons.
(A) Examples of nuclei stained with anti-NeuN (green) and counterstained with DAPI; arrowhead marks double-labeled cell. Notice absence of detectable background and autofluorescence in these samples that were processed without prior fixation (B) Representative FACS of unfixed NeuN labeled material similar to the one shown in (A) (top) and of negative control (bottom); blue dots mark sorted neuronal nuclei (NeuN+). (C) Heatmap showing methylation levels of neuronal DNA isolates for 10 different genes across the lifespan (range: 0.6–97 years). Each gene is grouped into quartiles (blue = 1 low, green = 2 medium-low, yellow = 3 medium high, red = 4 high extent of methylation). The larger the number of samples with no detectable methylation, the fewer the number of observations coded green and yellow. White space = no data. * = p<0.05 , Mann-Whitney U permutation based on comparison of immature/young (0.6–16 years) to old (62+years) samples. Notice that neuronal DNA from advanced age group shows significant increase in DNA methylation for 3/10 gene loci (PGR, SYK, HOXA1), but decreased levels at S100A2 locus.

References

    1. Tsankova N, Renthal W, Kumar A, Nestler EJ. Epigenetic regulation in psychiatric disorders. Nat Rev Neurosci. 2007;8:355–367. - PubMed
    1. Petronis A. Human morbid genetics revisited: relevance of epigenetics. Trends Genet. 2001;17:142–146. - PubMed
    1. Bird A. Perceptions of epigenetics. Nature. 2007;447:396–398. - PubMed
    1. Reik W. Stability and flexibility of epigenetic gene regulation in mammalian development. Nature. 2007;447:425–432. - PubMed
    1. Ausio J, Levin DB, De Amorim GV, Bakker S, Macleod PM. Syndromes of disordered chromatin remodeling. Clin Genet. 2003;64:83–95. - PubMed

Publication types

Substances