. 2008 Jul;110(2):297-307.
doi: 10.1007/s10549-007-9732-3. Epub 2007 Sep 19.

Central carbon metabolism in the progression of mammary carcinoma

Affiliations

Central carbon metabolism in the progression of mammary carcinoma

Adam D Richardson et al. Breast Cancer Res Treat. 2008 Jul.

Abstract

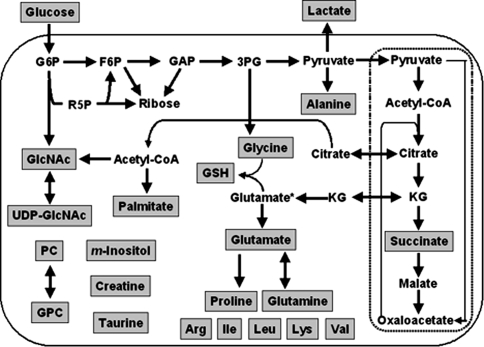
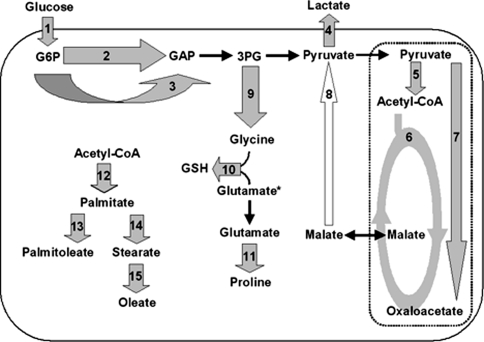
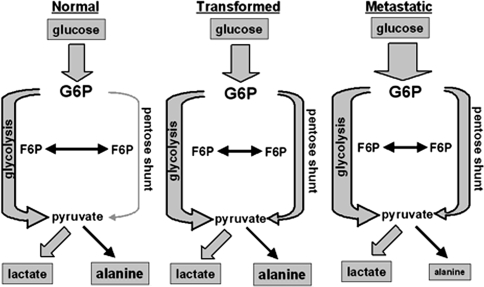
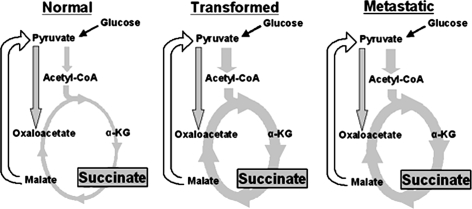
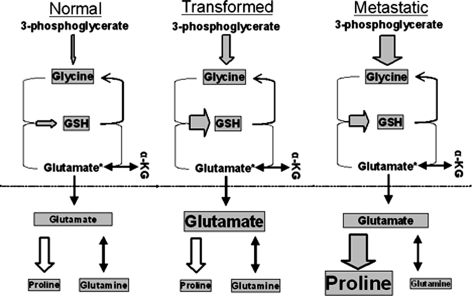
There is a growing belief that the metabolic program of breast tumor cells could be a therapeutic target. Yet, without detailed information on central carbon metabolism in breast tumors it is impossible to know which metabolic pathways to target, and how their inhibition might influence different stages of breast tumor progression. Here we perform the first comprehensive profiling of central metabolism in the MCF10 model of mammary carcinoma, where the steps of breast tumor progression (transformation, tumorigenicity and metastasis) can all be examined in the context of the same genetic background. The metabolism of [U-(13)C]-glucose by a series of progressively more aggressive MCF10 cell lines was tracked by 2D NMR and mass spectrometry. From this analysis the flux of carbon through distinct metabolic reactions was quantified by isotopomer modeling. The results indicate widespread changes to central metabolism upon cellular transformation including increased carbon flux through the pentose phosphate pathway (PPP), the TCA cycle, as well as increased synthesis of glutamate, glutathione and fatty acids (including elongation and desaturation). The de novo synthesis of glycine increased upon transformation as well as at each subsequent step of breast tumor cell progression. Interestingly, the major metabolic shift in metastatic cells is a large increase in the de novo synthesis of proline. This work provides the first comprehensive view of changes to central metabolism as a result of breast tumor progression.


Figures

Fig. 1
Fig. 1
Metabolites, fluxes and pathways quantified in the MCF10 tumor progression model. Metabolites presented in the shaded boxes were observed by NMR, GCMS or enzymatic assay. Abbreviations are G6P, glucose-6-phosphate; F6P, fructose-6-phosphate; R5P, ribose-5-phosphate; GAP, glyceraldehydes-3-phosphate; 3PG, 3-phosphoglycerate; KG, α-ketoglutarate; GSH, glutathione; GlcNAc, N-acetylglucosamine; PC, phosphocholine; GPC, glycerophosphocholine
Fig. 2
Fig. 2
Metabolic fluxes and pathway activities determined by isotopomer analysis or enzymatic assay. Flux 1: glucose import; 2: glycolysis; 3: pentose phosphate pathway; 4: lactate excretion; 5: pyruvate dehydrogenase flux; 6: TCA cycle flux; 7: pyruvate carboxylase flux; 8: gluconeogenic flux; 9: glycine biosynthesis; 10: glutathione biosynthesis; 11: proline biosynthesis; 12: palmitate biosynthesis (fatty acid synthase activity); 13: desaturation of palmitate; 14: elongation of palmitate; 15: desaturation of stearate
Fig. 3
Fig. 3
Relative distribution of the glucose-pyruvate local network in MCF10 cells. Flux through the pentose phosphate pathway increases as cells become progressively more tumorigenic. Observed metabolites are boxed in grey and their relative sizes between tumorigenic states are roughly proportional to the observed pool sizes. Observed fluxes are shown as grey arrows and their widths are roughly proportional to the relative pathway flux. See Table 1 for values. Normal is the MCF10-A cells; transformed is the MCF10-AT cells; metastatic is the MCF10-CA1a cells. G6P = glucose-6-phosphate; F6P = fructose-6-phosphate
Fig. 4
Fig. 4
Relative distribution of the TCA cycle in MCF10 cells. Flux through the TCA cycle and the pool size of succinate are higher in tumorigenic cells than in untransformed cells. Observed metabolites are boxed in grey and their relative sizes between tumorigenic states are roughly proportional to the observed pool sizes. Observed fluxes are shown as grey arrows and their widths are roughly proportional to the relative pathway flux. See Table 1 for values. Normal is the MCF10-A cells; transformed is the MCF10-AT cells; metastatic is the MCF10-CA1a cells. α-KG = α-ketoglutarate
Fig. 5
Fig. 5
Relative distribution of the glutamate–glutathione hub in MCF10 cells. Flux through the glycine–glutamine hub is higher in tumorigenic cells than in normal cells. Dramatic increases in the biosynthesis and pool size of proline coincide with the acquisition of the metastatic phenotype. Observed metabolites are boxed in grey and their relative sizes between tumorigenic states are roughly proportional to the pool sizes observed. Observed fluxes are shown as grey arrows and their widths are roughly proportional to the relative pathway flux. See Table 1 for values. Normal is the MCF10-A cells; transformed is the MCF10-AT cells; metastatic is the MCF10-CA1a cells; α-KG = α-ketoglutarate

References

    1. {'text': '', 'ref_index': 1, 'ids': [{'type': 'DOI', 'value': '10.1085/jgp.8.6.519', 'is_inner': False, 'url': 'https://doi.org/10.1085/jgp.8.6.519'}, {'type': 'PMC', 'value': 'PMC2140820', 'is_inner': False, 'url': 'https://pmc.ncbi.nlm.nih.gov/articles/PMC2140820/'}, {'type': 'PubMed', 'value': '19872213', 'is_inner': True, 'url': 'https://pubmed.ncbi.nlm.nih.gov/19872213/'}]}
    2. Warburg O, Wind F, Negelein E (1927) The metabolism of tumors in the body. J Gen Physiol 8:519–530 - PMC - PubMed
    1. {'text': '', 'ref_index': 1, 'ids': [{'type': 'DOI', 'value': '10.1158/0008-5472.CAN-06-1501', 'is_inner': False, 'url': 'https://doi.org/10.1158/0008-5472.can-06-1501'}, {'type': 'PubMed', 'value': '16982728', 'is_inner': True, 'url': 'https://pubmed.ncbi.nlm.nih.gov/16982728/'}]}
    2. Kim JW, Dang CV (2006) Cancer’s molecular sweet tooth and the Warburg effect. Cancer Res 66:8927–8930 - PubMed
    1. {'text': '', 'ref_index': 1, 'ids': [{'type': 'DOI', 'value': '10.1146/annurev.med.53.082901.104028', 'is_inner': False, 'url': 'https://doi.org/10.1146/annurev.med.53.082901.104028'}, {'type': 'PubMed', 'value': '11818465', 'is_inner': True, 'url': 'https://pubmed.ncbi.nlm.nih.gov/11818465/'}]}
    2. Czernin J, Phelps ME (2002) Positron emission tomography scanning: current and future applications. Annu Rev Med 53:89–112 - PubMed
    1. {'text': '', 'ref_index': 1, 'ids': [{'type': 'DOI', 'value': '10.1016/j.bbrc.2003.11.136', 'is_inner': False, 'url': 'https://doi.org/10.1016/j.bbrc.2003.11.136'}, {'type': 'PubMed', 'value': '14697210', 'is_inner': True, 'url': 'https://pubmed.ncbi.nlm.nih.gov/14697210/'}]}
    2. Zu XL, Guppy M (2004) Cancer metabolism: facts, fantasy, and fiction. Biochem Biophys Res Commun 313:459–465 - PubMed
    1. {'text': '', 'ref_index': 1, 'ids': [{'type': 'DOI', 'value': '10.1023/A:1009577811584', 'is_inner': False, 'url': 'https://doi.org/10.1023/a:1009577811584'}, {'type': 'PubMed', 'value': '14973383', 'is_inner': True, 'url': 'https://pubmed.ncbi.nlm.nih.gov/14973383/'}]}
    2. Miller FR (2000) Xenograft models of premalignant breast disease. J Mammary Gland Biol Neoplasia 5:379–391 - PubMed

Publication types