. 2007 Nov;71(11):905-14.
doi: 10.1002/cyto.a.20469.

Cytometric assessment of DNA damage by exogenous and endogenous oxidants reports aging-related processes

Affiliations

Cytometric assessment of DNA damage by exogenous and endogenous oxidants reports aging-related processes

Hong Zhao et al. Cytometry A. 2007 Nov.

Abstract

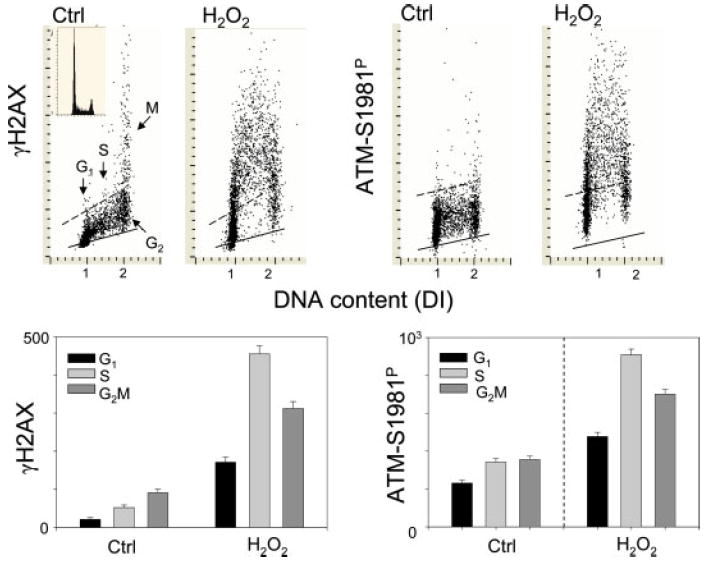
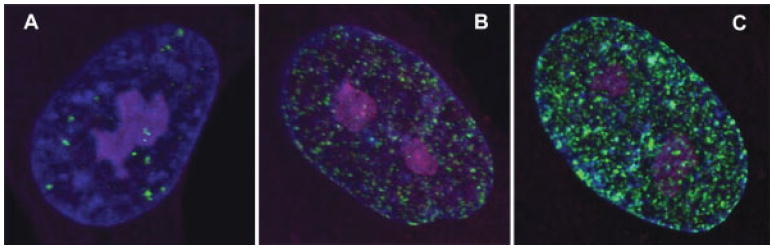
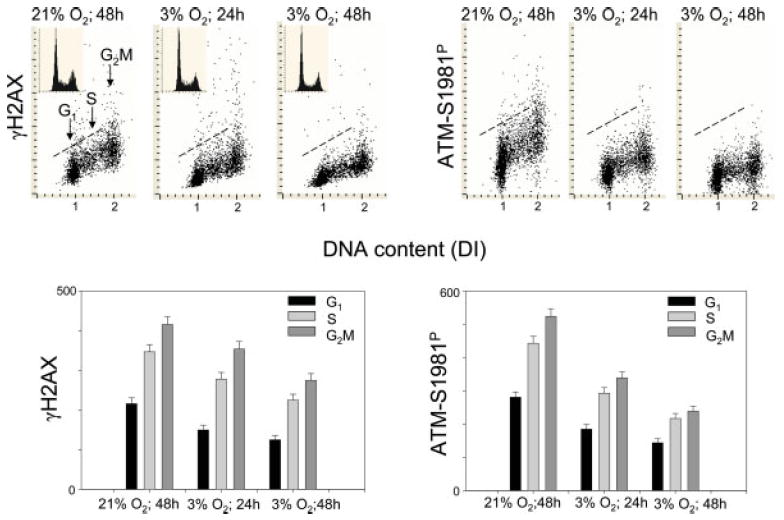
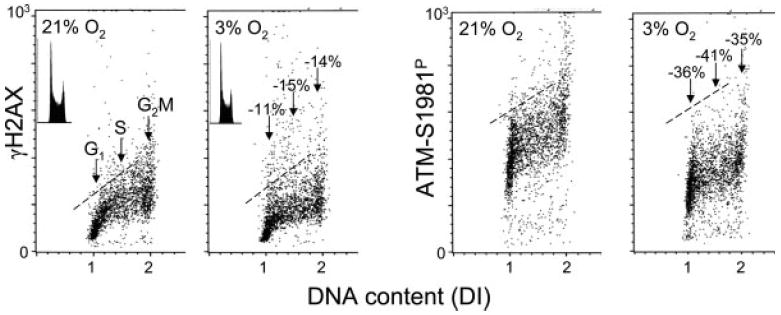
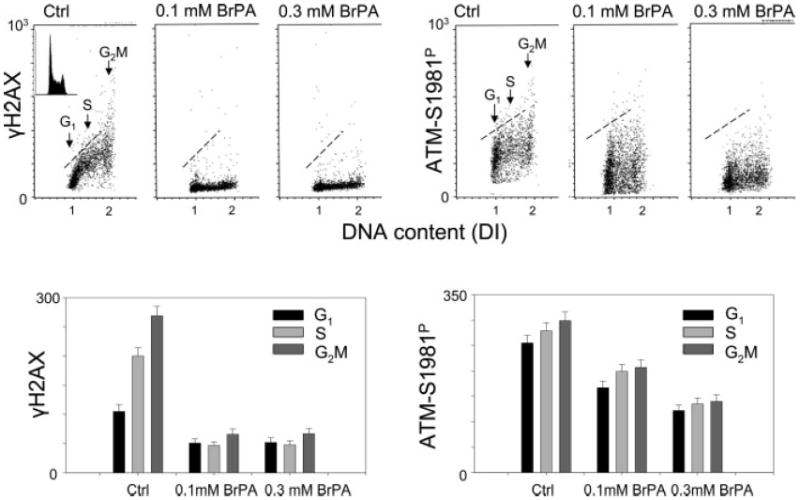
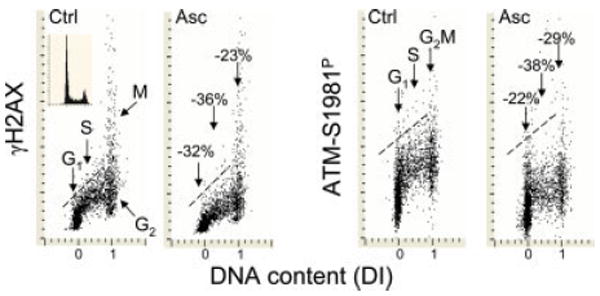
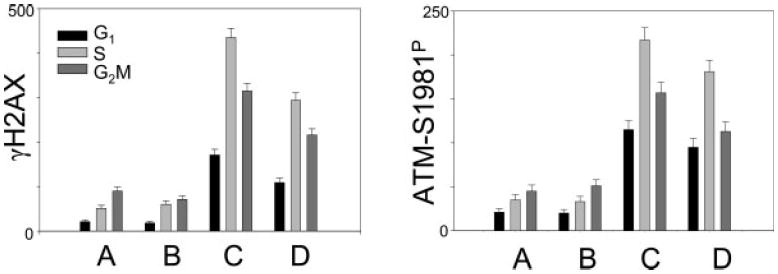
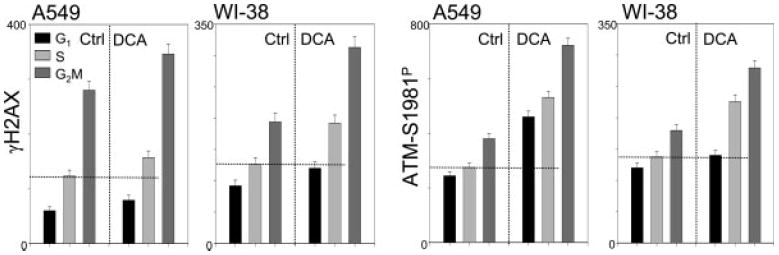
The ongoing DNA damage caused by reactive oxygen species generated during oxidative metabolism is considered a key factor contributing to cell aging as well as preconditioning cells to neoplastic transformation. We postulated before that a significant fraction of constitutive histone H2AX phosphorylation (CHP) and constitutive activation of ATM (CAA) seen in untreated normal and tumor cells occurs in response to such DNA damage. In the present study, we provide further evidence in support of this postulate. The level of ATM activation and H2AX phosphorylation, detected immunocytochemically, has been monitored in WI-38, A549, and TK6 cells treated with H2O2 as well as growing under conditions known or suspected to affect the level of endogenous oxidants. Thirty- to 60-min exposure of cells to 100 or 200 microM H2O2 led to an increase in the level of H2AX phosphorylation and ATM activation, particularly pronounced (nearly fivefold) in S-phase cells. Cell growth for 24-48 h under hypoxic conditions (3% O2) distinctly lowered the level of CHP and CAA while it had minor effect on cell cycle progression. Treatment (4 h) with 0.1 or 0.3 mM 3-bromopyruvate, an inhibitor of glycolysis and mitochondrial oxidative phosphorylation, reduced the level of CHP (up to fourfold) and also decreased the level of CAA. Growth of WI-38 cells in 2% serum concentration for 48 h led to a 25 and 30% reduction in CHP and CHA, respectively, compared with cells growing in 10% serum. The antioxidant vitamin C (2 mM) reduced CHP and CAA by 20-30% after 24 h of treatment, while the COX-2 inhibitor celecoxib (5 microM) had a minor effect on CHP and CAA, though it decreased the level of H2O2-induced H2AX phosphorylation and ATM activation. In contrast, dichloroacetate known to shift metabolism from anaerobic to oxidative glycolysis through its effect on pyruvate dehydrogenase kinase enhanced the level of CHP and CAA. Our present data and earlier observations strongly support the postulate that a large fraction of CHP and CAA occurs in response to DNA damage caused by metabolically generated oxidants. Cytometric analysis of CHP and CAA provides the means to measure the effectiveness of exogenous factors, which either through lowering aerobic metabolism or neutralizing radicals may protect DNA from such damage.


Figures

Figure 1
Figure 1
Effect of H2O2 on H2AX phosphorylation and ATM activation in A549 cells. Bivariate distributions representing expression of γH2AX or ATM-S1981P vs. DNA content of A549 cells untreated (Ctrl) or treated with 200 μM of H2O2 for 1 h (top panels). The dashed skewed lines show the upper threshold level of γH2AX and ATM-S1981P expression for 97% of interphase cells in the untreated (Ctrl) cultures. The solid skewed lines represent the upper threshold of fluorescence of cells stained with irrelevant IgG instead of γH2AX and ATM-S1981P primary Ab (negative control). DNA content histogram showing the cell cycle distribution of the cells is shown in the upper left (Fig. 1; Ctrl) panel, 1-h exposure to H2O2 had no significant effect on their cell cycle (not shown). By gating analysis based on differences in DNA content, the mean values of γH2AX or ATM-S1981P IF (±SE) were calculated for cell populations in G1, S, and G2M and plotted as bar graphs (bottom panels). [Color figure can be viewed in the online issue, which is available at www.interscience.wiley.com.]
Figure 2
Figure 2
Subcellular localization of γH2AX foci in interphase MSU 1.1 human fibroblasts (41), untreated (A) or treated with 100 μM (B) or 200 μM (C) of H2O2 for 30 min, revealed by confocal microscopy (42,46). Expression of γH2AX is reported by Alexa 488-tagged secondary Ab (green fluorescence). Cells were counterstained sequentially with DRAQ5 (DNA, long wavelength-red emission, shown as blue) followed by PI (DNA and RNA, red) resulting in blue coloration of chromatin structures and pink of nucleoli.
Figure 3
Figure 3
Effect of growth of WI-38 cells at reduced O2 concentration on CHP and CAA. Bivariate (γH2AX or ATM-S1981P vs. DNA content) distributions of WI-38 cells, growing for 24 or 48 h at 21% or at a reduced (3%) concentration of O2. The dashed skewed lines show the upper threshold level of γH2AX and ATM-S1981P expression for 97% of interphase cells growing at 21% O2. Insets in each panel show cellular DNA content frequency histograms from the respective cultures. The mean values of γH2AX or ATM-S1981P IF (±SE) were calculated for cell populations in G1, S, and G2M and plotted as bar graphs in the bottom panels. [Color figure can be viewed in the online issue, which is available at www.interscience.wiley.com.]
Figure 4
Figure 4
Effect of growth of human lymphoblastoid TK6 cells at reduced O2 concentration on CHP and CAA. Bivariate (γH2AX or ATM-S1981P vs. DNA content) distributions of TK6 cells growing for 24 h at 21% or at reduced (3%) concentration of O2. The dashed skewed lines show the upper threshold level of γH2AX and ATM-S1981P expression for 97% of interphase cells growing at 21% O2. Insets show cellular DNA content frequency histograms from the respective cultures. The mean values of γH2AX or ATM-S1981P IF (±SE) were calculated for cell populations in G1, S, and G2M; the percent decrease of these means in cells growing at 3% O2 in relation to cells growing at 21% O2 are listed in the respective panels. Cellular fluorescence was measured by flow cytometry.
Figure 5
Figure 5
Effect of 3-bromopyruvate (BrPA) on CHP and CAA in TK6 cells. Bivariate (γH2AX or ATM-S1981P vs. DNA content) distributions representing TK6 cells untreated and treated with 0.1 or 0.3 mM BrPA for 4 h. The dashed skewed lines show the upper threshold level of γH2AX and ATM-S1981P expression for 97% of interphase cells in the untreated (Ctrl) cultures. DNA content histogram showing the cell cycle distribution of the cells is shown in the upper left (Ctrl) panel. Four-hour exposure to either concentration of BrPA had no significant effect on their cell cycle (not shown). The mean values of γH2AX or ATM-S1981P IF (±SE) for G1, S, and G2M cell populations are shown as bar graphs (bottom panels). Cellular fluorescence was measured by flow cytometry.
Figure 6
Figure 6
Effect of vitamin C (Asc; sodium ascorbate) on CHP and CAA in A549 cells. Bivariate (γH2AX or ATM-S1981P vs. DNA content) distributions illustrating effect of Asc on the level of CHP and CAA in A549 cells. The cells were either untreated (Ctrl) or maintained in the presence of 2 mM Asc for 24 h. As in Figs. 2-5 the dashed skewed lines show the upper threshold level of γH2AX or ATM-S1981P expression for 97% of interphase cells growing in the absence of Asc (Ctrl). The inset shows cellular DNA content frequency histogram from the untreated culture; cell growth in the presence of 2 mM Asc for 24 h had no detectable effect of DNA content distribution. The mean values of γH2AX or ATM- S1981P IF (±SE) were calculated for cell populations in G1, S, and G2M and the percent decrease of these means in cells growing in the presence of Asc in relation to Ctrl are presented in the respective Asc panels. Cellular fluorescence was measured by LSC. [Color figure can be viewed in the online issue, which is available at www.interscience.wiley.com.]
Figure 7
Figure 7
Effect of celecoxib on CHP and CAA as well as on the H2O2-induced H2AX phosphorylation and ATM activation in A549 cells. A549 cells were maintained in the culture in the absence (A,C) or presence of 5 μM celecoxib (B,D) for 3 days. The cells were then treated with 100 μM H2O2 for 30 min (C,D) and fixed, and the expression of γH2AX and ATM-S1981P detected immunocytochemically, concurrently with DNA content, was measured by LSC. The mean (±SE) IF of γH2AX and ATM-S1981P was estimated for G1, S, and G2M cell populations and plotted as bar graphs. Note the little effect of celecoxib alone on expression of γH2AX and ATM-S1981P (B vs. A), whereas the H2O2-induced increase in γH2AX and ATM-S1981P IF was distinctly attenuated in the cultures containing celecoxib (D vs. C).
Figure 8
Figure 8
Effect of DCA on CHP and CAA in A549 and WI-38 cells. The cells were left untreated (Ctrl) or were treated with 5 μM DCA for 24 h (DCA), then fixed, and their expression of γH2AX and ATM-S1981P, concurrently with DNA content, measured by LSC. The mean (±SE) IF of γH2AX and ATM-S1981P was estimated for G1, S, and G2M cell populations and plotted as bar graphs. For visual comparison of the data, the dashed vertical line shows the mean value of the untreated S-phase cells to be compared with the S-phase DCA-treated cells.

Comment in

Similar articles

Cited by

References

    1. Barzilai A, Yamamoto K. DNA damage responses to oxidative stress. DNA repair (Amst) 2004;3:1109–1115. - PubMed
    1. Nohl H. Generation of superoxide radicals as byproducts of cellular respiration. Ann Biol Clin. 1994;52:199–204. - PubMed
    1. Moller P, Loft S. Interventions with antioxidants and nutrients in relation to oxidative DNA damage and repair. Mutat Res. 2004;551:79–89. - PubMed
    1. Beckman KB, Ames BN. Oxidative decay of DNA. J Biol Chem. 1997;272:13300–13305. - PubMed
    1. Dianov GL, Parsons JL. Co-ordination of DNA single strand break repair. DNA repair (Amst) 2007;6:454–460. - PubMed

Publication types

MeSH terms