

Examination of barriers and barrier alteration in transscleral iontophoresis
- PMID: 17879296
- PMCID: PMC2556221
- DOI: 10.1002/jps.21003
Examination of barriers and barrier alteration in transscleral iontophoresis
Abstract
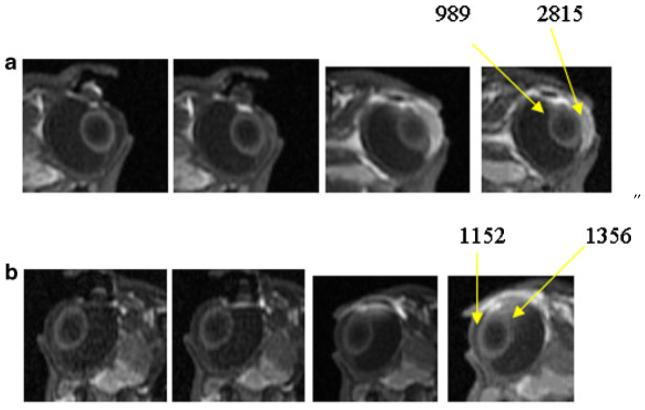
The flux enhancing mechanisms of transscleral iontophoresis are not well understood. The objective of the present study was to investigate the ocular barrier and barrier alterations in transscleral iontophoretic delivery with magnetic resonance imaging (MRI). Experiments involving constant current transscleral iontophoresis of 2 mA (current density 10 mA/cm(2)) and subconjunctival injection were conducted with rabbits in vivo and postmortem and with excised sclera in side-by-side diffusion cells in vitro. The postmortem and in vitro experiments were expected to be helpful in clarifying the importance of vascular clearance and other transport barriers in transscleral iontophoresis. Manganese ion (Mn(2+)) and manganese ethylenediaminetetraacetic acid complex (MnEDTA(2-)) were the model permeants. The results show that pretreatment of the eye with an electric field by iontophoresis enhanced subconjunctival delivery of the permeants to the anterior segment of the eye in vivo. This suggests that electric field-induced barrier alterations can be an important absorption enhancing mechanism of ocular iontophoresis. Penetration enhancement was magnified in the postmortem experiments with larger amounts of the permeants delivered into the eye and to the back of the eye. The different results observed in the in vivo and postmortem studies can be attributed to ocular clearance in ocular delivery.
Figures
Similar articles
-
Examination of penetration routes and distribution of ionic permeants during and after transscleral iontophoresis with magnetic resonance imaging.Int J Pharm. 2007 Apr 20;335(1-2):46-53. doi: 10.1016/j.ijpharm.2006.11.001. Epub 2006 Nov 3. Int J Pharm. 2007. PMID: 17236728 Free PMC article.
-
Assessment of subconjunctival delivery with model ionic permeants and magnetic resonance imaging.Pharm Res. 2004 Dec;21(12):2175-84. doi: 10.1007/s11095-004-7669-3. Pharm Res. 2004. PMID: 15648248
-
Magnetic resonance imaging study of current and ion delivery into the eye during transscleral and transcorneal iontophoresis.Invest Ophthalmol Vis Sci. 2004 Apr;45(4):1224-31. doi: 10.1167/iovs.03-0821. Invest Ophthalmol Vis Sci. 2004. PMID: 15037591
-
Transscleral passive and iontophoretic transport: theory and analysis.Expert Opin Drug Deliv. 2018 Mar;15(3):283-299. doi: 10.1080/17425247.2018.1406918. Epub 2017 Dec 5. Expert Opin Drug Deliv. 2018. PMID: 29149574 Review.
-
Basic principles and current status of transcorneal and transscleral iontophoresis.Expert Opin Drug Deliv. 2017 Sep;14(9):1091-1102. doi: 10.1080/17425247.2017.1266334. Epub 2016 Dec 11. Expert Opin Drug Deliv. 2017. PMID: 27892757 Review.
Cited by
-
Lipid-Based Nanocarriers for Ophthalmic Administration: Towards Experimental Design Implementation.Pharmaceutics. 2021 Mar 26;13(4):447. doi: 10.3390/pharmaceutics13040447. Pharmaceutics. 2021. PMID: 33810399 Free PMC article. Review.
-
The Emerging Role of Topical Ocular Drugs to Target the Posterior Eye.Ophthalmol Ther. 2021 Sep;10(3):465-494. doi: 10.1007/s40123-021-00365-y. Epub 2021 Jul 4. Ophthalmol Ther. 2021. PMID: 34218424 Free PMC article. Review.
-
Ocular pharmacokinetic study using T₁ mapping and Gd-chelate- labeled polymers.Pharm Res. 2011 Dec;28(12):3180-8. doi: 10.1007/s11095-011-0507-5. Epub 2011 Jun 21. Pharm Res. 2011. PMID: 21691891 Free PMC article.
-
Transscleral iontophoretic and intravitreal delivery of a macromolecule: study of ocular distribution in vivo and postmortem with MRI.Exp Eye Res. 2009 Mar;88(3):418-25. doi: 10.1016/j.exer.2008.10.010. Epub 2008 Nov 1. Exp Eye Res. 2009. PMID: 19000673 Free PMC article.
-
Corneal permeability assay of topical eye drop solutions in rabbits by MRI.J Huazhong Univ Sci Technolog Med Sci. 2010 Dec;30(6):804-8. doi: 10.1007/s11596-010-0662-7. Epub 2010 Dec 22. J Huazhong Univ Sci Technolog Med Sci. 2010. PMID: 21181376
References
-
- Yoo SH, Dursun D, Dubovy S, Miller D, Alfonso E, Forster RK, Behar-Cohen FF, Parel JM. Iontophoresis for the treatment of paecilomyces keratitis. Cornea. 2002;21:131–132. - PubMed
-
- Eljarrat-Binstock E, Raiskup F, Frucht-Pery J, Domb AJ. Transcorneal and transscleral iontophoresis of dexamethasone phosphate using drug loaded hydrogel. J Control Release. 2005;106:386–390. - PubMed
-
- Behar-Cohen FF, Parel JM, Pouliquen Y, Thillaye-Goldenberg B, Goureau O, Heydolph S, Courtois Y, De Kozak Y. Iontophoresis of dexamethasone in the treatment of endotoxin-induced-uveitis in rats. Exp Eye Res. 1997;65:533–545. - PubMed
-
- Lam TT, Edward DP, Zhu XA, Tso MO. Transscleral iontophoresis of dexamethasone. Arch Ophthalmol. 1989;107:1368–1371. - PubMed
-
- Behar-Cohen FF, El Aouni A, Gautier S, David G, Davis J, Chapon P, Parel JM. Transscleral coulomb-controlled iontophoresis of methylprednisolone into the rabbit eye: Influence of duration of treatment, current intensity, and drug concentration on ocular tissue and fluid levels. Exp Eye Res. 2002;74:51–59. - PubMed
Publication types
MeSH terms
Grants and funding
LinkOut - more resources
Full Text Sources
