Comparative Study
. 2007;35(19):6399-413.
doi: 10.1093/nar/gkm680. Epub 2007 Sep 18.

Global control of aberrant splice-site activation by auxiliary splicing sequences: evidence for a gradient in exon and intron definition

Affiliations
Comparative Study

Global control of aberrant splice-site activation by auxiliary splicing sequences: evidence for a gradient in exon and intron definition

Jana Královicová et al. Nucleic Acids Res. 2007.

Abstract

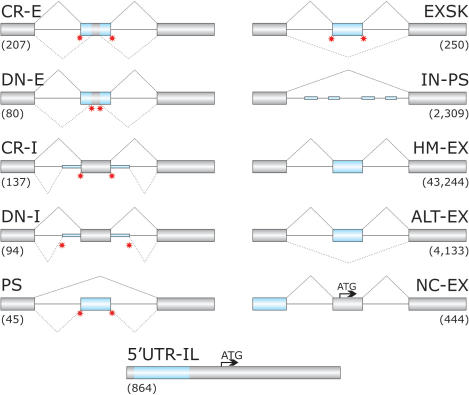
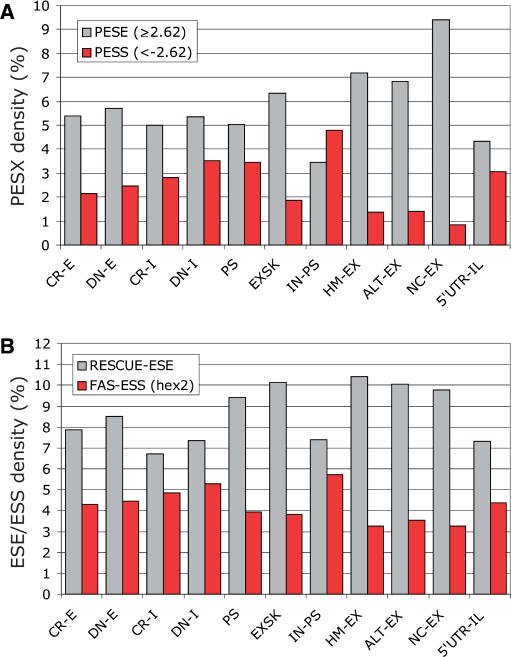
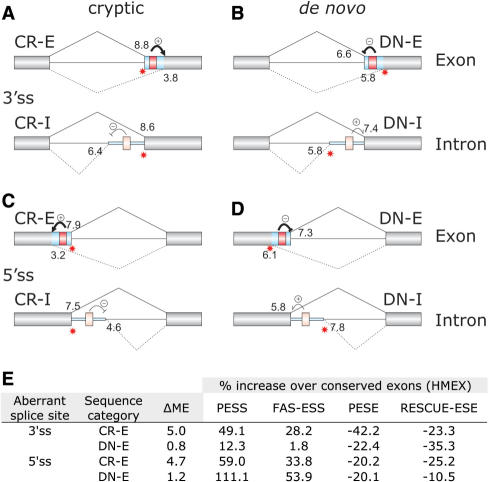
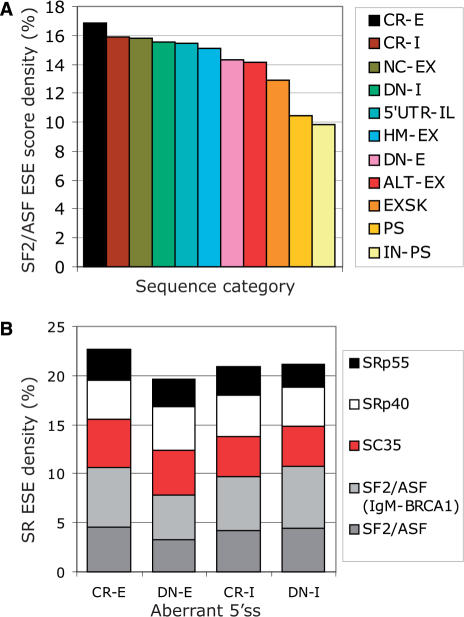
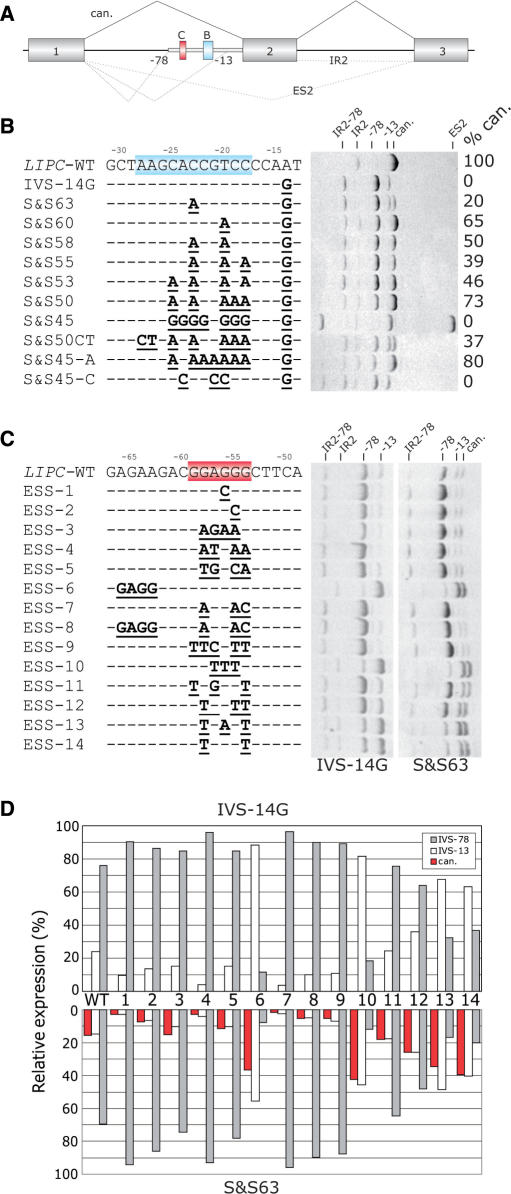
Auxiliary splicing signals play a major role in the regulation of constitutive and alternative pre-mRNA splicing, but their relative importance in selection of mutation-induced cryptic or de novo splice sites is poorly understood. Here, we show that exonic sequences between authentic and aberrant splice sites that were activated by splice-site mutations in human disease genes have lower frequencies of splicing enhancers and higher frequencies of splicing silencers than average exons. Conversely, sequences between authentic and intronic aberrant splice sites have more enhancers and less silencers than average introns. Exons that were skipped as a result of splice-site mutations were smaller, had lower SF2/ASF motif scores, a decreased availability of decoy splice sites and a higher density of silencers than exons in which splice-site mutation activated cryptic splice sites. These four variables were the strongest predictors of the two aberrant splicing events in a logistic regression model. Elimination or weakening of predicted silencers in two reporters consistently promoted use of intron-proximal splice sites if these elements were maintained at their original positions, with their modular combinations producing expected modification of splicing. Together, these results show the existence of a gradient in exon and intron definition at the level of pre-mRNA splicing and provide a basis for the development of computational tools that predict aberrant splicing outcomes.


Figures

Figure 1.
Figure 1.
Schematic representation of sequence categories. Primary transcripts are shown as exons (boxes) and introns (lines). Exonic or intronic sequences analysed in this study are shown as blue boxes or blue thick lines, respectively. Canonical and aberrant splicing events are shown above and below primary transcripts, respectively. Disease-associated splicing mutations are schematically shown as red stars. Designation of each sequence category and corresponding numbers of analysed sequences is above and below the primary transcript, respectively. Arrows denote translation initiation sites. CR-E, sequences between cryptic splice sites in exons and their authentic counterparts; DN-E, sequences between de novo splice sites in exons and their authentic counterparts; CR-I, cryptic splice sites in introns; DN-I, de novo splice sites in introns; PS, sequences of mutation-induced pseudoexons (Table S2); EXSK, sequences of exons that were skipped as a result of splice-site mutations leading to disease phenotypes (Table S1); IN-PS, intronic sequences that have strong 3′ss and 5′ss and a size of 50–250 nt, but were never used by the spliceosome (14); HM-EX, human exons homologous to mouse exons (30); ALT-EX, alternatively spliced human exons (30); NC-EX, non-coding exons lacking protein-coding information (14); 5′-UTR-IL, sequences of 5′UTR in intron-less genes (14). The total length of the sequence categories (in nucleotides, nt) was 10 383; 7862; 10 686; 6988; 6114; 29 292; 352 688; 5 817 754; 513 162; 50 187 and 245 076, respectively.
Figure 2.
Figure 2.
Density of auxiliary splicing signals in each sequence category. Grey/red bars represent the total number of ESEs/ESSs in each sequence category divided by the total length of sequence group and multiplied by 100. Designation of sequence categories is the same as in Figure 1. (A) Density of PESE and PESS octamers (14). (B) Density of RESCUE-ESEs (13) and FAS-ESSs (32).
Figure 3.
Figure 3.
Predicted effect of ESSs on selection of cryptic and de novo splice sites in each sequence category. Designation of sequence categories and schematic representation of exons, introns and aberrant transcripts is the same as in Figure 1. Putative strong (red) or weak (pink) ESSs are schematically shown as boxes between cryptic (A,C) or de novo (B,D) splice sites and their authentic counterparts. Location of aberrant splice sites is shown on the right. Their expected inhibitory or stimulatory effects on competing splice sites are shown by the minus and plus signs, with weak and strong effects denoted by thin and thick arrows, respectively. The mean maximum entropy (ME) scores (36) for canonical and aberrant splice sites in each category are shown above and below the primary transcript, respectively. The updated ME scores were computed for 305 aberrant 3′ss (A,B) and 258 aberrant 5′ss (C,D) and their authentic counterparts as described (24,25). (E) Comparison of the intrinsic strength of aberrant splice sites in exons with the ESS/ESE densities. ΔME is the difference in the mean ME scores between authentic and aberrant splice sites. The mean scores are shown in panels A–D. The increase [PESS (I and P score <−2.62) and FAS-ESS (hex 2 set)] or decrease [PESE (I and P score ≥ 2.62) and RESCUE-ESE] of ESE/ESS densities in CR-E/DN-E segments over conserved exons is shown as a percentage for each sequence category.
Figure 4.
Figure 4.
Control of aberrant splice-site activation by predicted SF2/ASF ESE motifs. (A) A rainbow gradient of SF2/ASF-mediated exon/intron definition. The SF2/ASF ESE score density (IgM-BRCA1 version) was calculated as a sum of SF2/ASF ESE scores in each sequence group, divided by the sequence length and multiplied by 100. Each category is denoted by a colour shown on the right. Sequence categories were ordered from the highest score density to the lowest. For HM-EX and ALT-EX, only 1000 randomly selected sequences were analysed due to size limitations of the server. (B) The SR ESE motif densities in aberrant 5′ss. Each SR protein is represented by a colour shown on the right side.
Figure 5.
Figure 5.
Pseudoexon splice sites created by intronic mutations are strong. The average ME scores of splice donor (black bars) and acceptor (grey bars) sites of pseudoexons that were activated by mutations in 5′ss (left panel) or 3′ss (right panel). Error bars represent standard deviations.
Figure 6.
Figure 6.
Exons that were skipped as a result of splicing mutations are shorter than average exons and have weak 3′ss. (A) Length distribution of 250 skipped exons (EXSK). The observed distribution is shown as black bars. The expected distribution (grey bars) was calculated for the same number of exons using exon sizes of 43 244 homologous human-mouse exons (30). (B) Comparison of the intrinsic strength of 3′ss between exons that were skipped as a result of splice-site mutation (EXSK), and conserved (HM-EX) and alternatively spliced exons (ALT-EX). Grey bars represent means; error bars denote standard deviations; horizontal lines with labels are medians.
Figure 7.
Figure 7.
The SF2/ASF ESE density in exons activating cryptic 5′ and 3′ss, in skipped exons and conserved human exons. Dark and light grey bars denote the total number of original SF2/ASF and updated SF2/ASF ESE motifs per 100 nt, respectively.
Figure 8.
Figure 8.
FAS-ESS-mediated inhibition of authentic 3′ss of INS intron 2 and its effects on proinsulin production. (A) INS construct. Primary transcripts are represented by exons (boxes) and introns (lines). The length of each intron and exon is shown above the primary transcript (in nucleotides). Canonical and alternative splicing is denoted by dotted lines above and below the pre-mRNA, respectively. RNA products containing exon 2 are numbered 3–6 as described previously (20). For simplicity, RNA isoforms 1 and 2 are not shown as they are expressed in very low levels. An exonic segment between two competing 3′ss is shown in blue. (B) Multiple alignment of human (h), chimpanzee (c), mouse (m) and rat (r) sequences and computationally predicted auxiliary splicing elements. Intron 2 is shown in lowercase, exon 3 is in upper case. Black asterisks denote nucleotides shared between the species. A red star shows a G/T variant in a predicted human-specific FAS-ESS. Alternative 3′ss at exon position +36 and +74 are shown by arrows. FAS-ESSs (10,32) are in red, RESCUE-ESEs (13,31) are in blue, PESEs (14) are in green and putative ESRs (16) are in brown below the sequence. The first nucleotide of octamer PESEs with the P and I scores above 2.88 (14) are underlined. The FAS-ESS hex3 set (10,32) is underlined in red. (C) Nucleotide sequences of the wild-type (WT) and mutated (2–17) splicing reporter constructs. Mutations are in bold and underlined. Nucleotides identical to the wild-type are denoted by a dash. (D) Relative expression of exon 2-containing INS mRNA isoforms. The splicing pattern of the WT and mutated (lanes 2–17) constructs is shown in the lower panel. Alternatively spliced products are shown on the left and correspond to numbers shown in panel A. Utilization (percent) of each isoform is shown in the upper panel. Error bars indicate standard deviations of a single transfection experiment in triplicate. (E) Subphysiological temperatures activate cryptic 3′ss +36 and +126 in exon 3 and promotes splicing of intron 1 in the wild-type minigene. The cryptic 3′ss (20) are denoted by arrows in panel A. Relative representation of RNA isoforms 1 and 2 that lack exon 1 was not altered (data not shown), whereas isoforms 5 and 6 were less abundant. (F) Proinsulin secretion by 293T cells following transfection of the wild-type (WT) and mutated constructs 8 and 12. Mutations are shown in panel C.
Figure 9.
Figure 9.
Silencer-mediated inhibition of intron-proximal 3′ss of LIPC intron 2. (A) Schematic representation of the LIPC splicing reporter. Exons, introns and aberrant splicing patterns are denoted as in Figure 8. Aberrant 3′ss 78 and 13 nt upstream of canonical (can.) 3′ss of intron 1 are designated by numbers. Blue and red boxes indicate sequences shown in panels B and C, respectively. Thick grey line represents an intronic segment retained in the mature mRNA transcribed from constructs carrying mutation IVS1-14A > G. (B) Splicing pattern of LIPC minigenes mutated upstream of the newly created 3′AG (highlighted in blue). Clone designation (S&Sn, where n is the approximate Shapiro–Senapathy score of the aberrant 3′ss 13 nt upstream of the authentic 3′ss) and mutations are shown on the left and the resulting RNA products on the right. The percentage of the canonically spliced isoform is designated with %can. The identity of each RNA product is shown at the top. IR2, retention of intron 2; ES2, skipping of exon 2. (C) Splicing pattern of LIPC minigenes mutated in a putative FAS-ESS (highlighted in red). Clone designation and mutations are shown on the left. RNA products of minigenes −14G and S&S63 (see panel B) are shown on the right. (D) Relative mRNA expression of wild-type (WT) and mutated (ESS1-14) clones lacking intron 2. Canonical products (can.) are shown in red and the amount of splicing to aberrant 3′ss −13 and −78 in white and grey, respectively.

Similar articles

Cited by

References

    1. Liu HX, Zhang M, Krainer AR. Identification of functional exonic splicing enhancer motifs recognized by individual SR proteins. Genes Dev. 1998;12:1998–2012. - PMC - PubMed
    1. Ghetti A, Pinol-Roma S, Michael WM, Morandi C, Dreyfuss G. hnRNP I, the polypyrimidine tract-binding protein: distinct nuclear localization and association with hnRNAs. Nucleic Acids Res. 1992;20:3671–3678. - PMC - PubMed
    1. Matunis MJ, Xing J, Dreyfuss G. The hnRNP F protein: unique primary structure, nucleic acid-binding properties, and subcellular localization. Nucleic Acids Res. 1994;22:1059–1067. - PMC - PubMed
    1. Burd CG, Dreyfuss G. RNA binding specificity of hnRNP A1: significance of hnRNP A1 high-affinity binding sites in pre-mRNA splicing. EMBO J. 1994;13:1197–1204. - PMC - PubMed
    1. Caputi M, Zahler AM. Determination of the RNA binding specificity of the heterogeneous nuclear ribonucleoprotein (hnRNP) H/H'/F/2H9 family. J. Biol. Chem. 2001;276:43850–43859. - PubMed

Publication types