Comparative Study
. 2007 Sep 19;27(38):10143-52.
doi: 10.1523/JNEUROSCI.2754-07.2007.

Interkinetic nuclear migration and the selection of neurogenic cell divisions during vertebrate retinogenesis

Affiliations
Comparative Study

Interkinetic nuclear migration and the selection of neurogenic cell divisions during vertebrate retinogenesis

Lisa M Baye et al. J Neurosci. .

Abstract

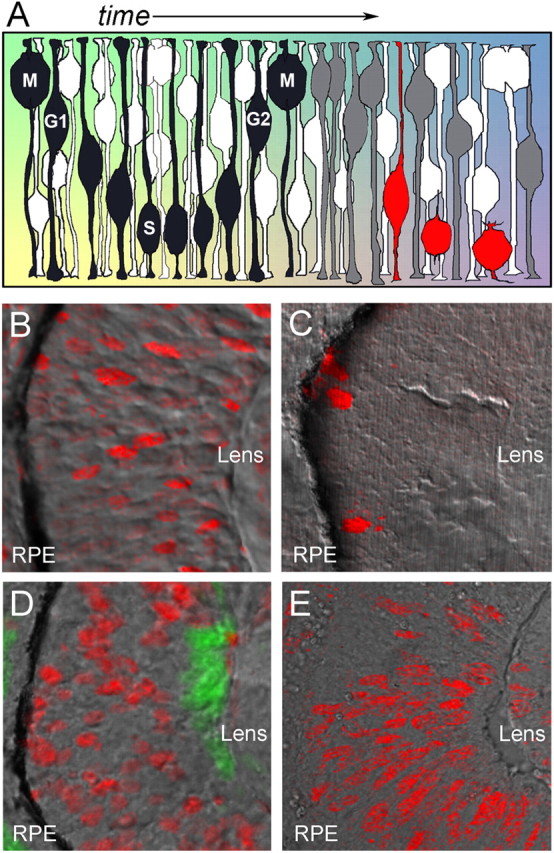
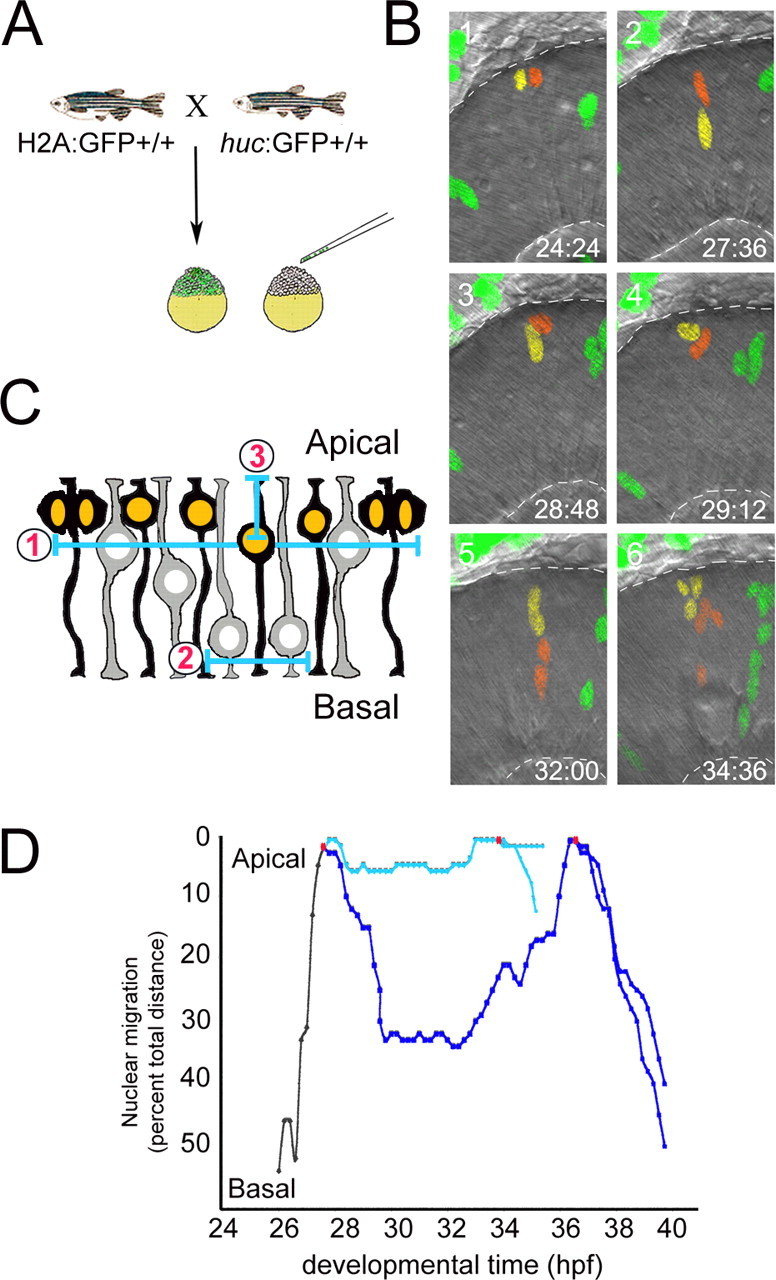
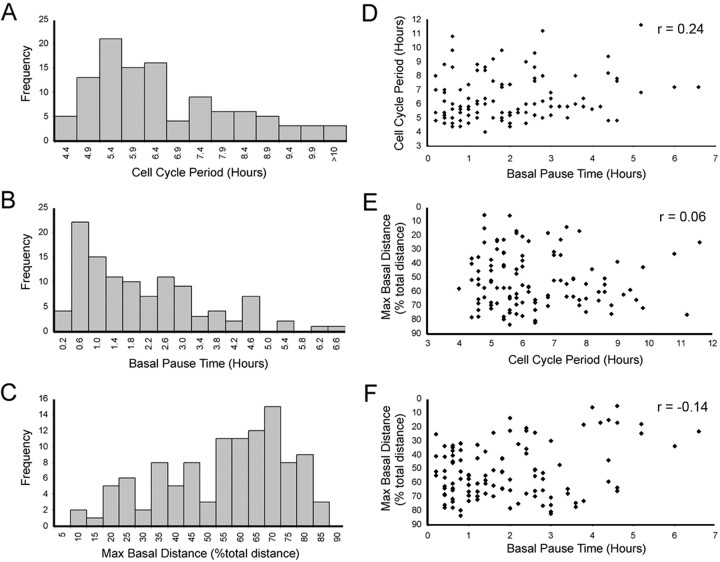
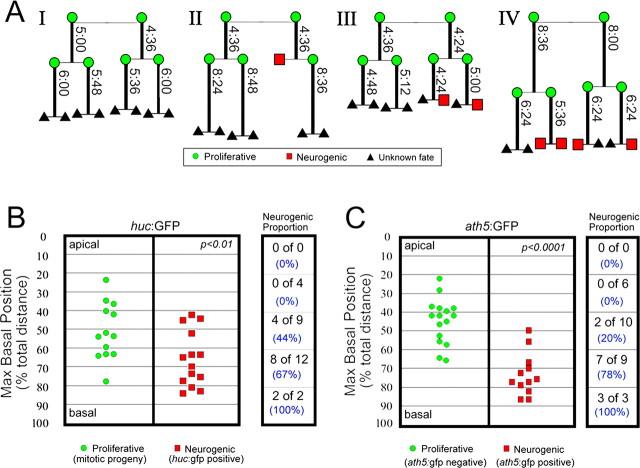
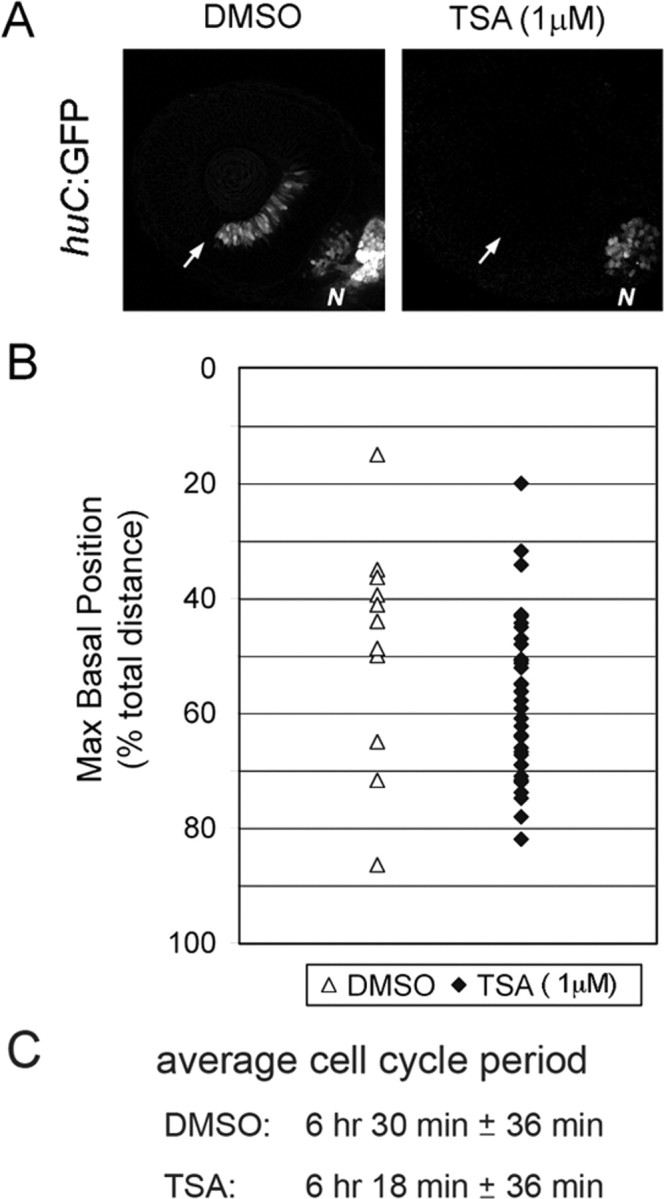
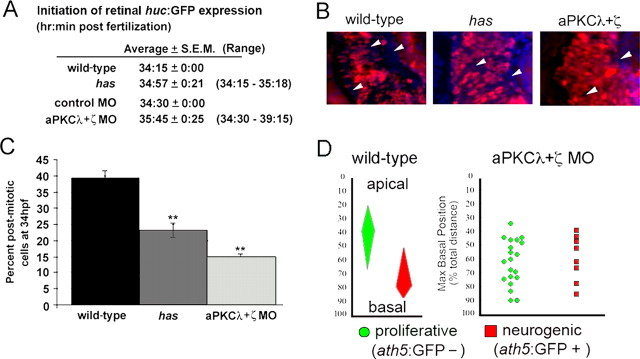
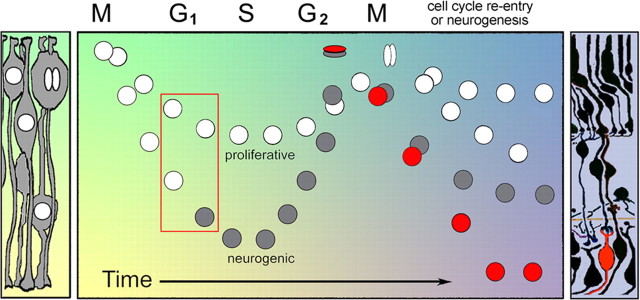
During retinal development, neuroepithelial progenitor cells divide in either a symmetric proliferative mode, in which both daughter cells remain mitotic, or in a neurogenic mode, in which at least one daughter cell exits the cell cycle and differentiates as a neuron. Although the cellular mechanisms of neurogenesis remain unknown, heterogeneity in cell behaviors has been postulated to influence this cell fate. In this study, we analyze interkinetic nuclear migration, the apical-basal movement of nuclei in phase with the cell cycle, and the relationship of this cell behavior to neurogenesis. Using time-lapse imaging in zebrafish, we show that various parameters of interkinetic nuclear migration are significantly heterogeneous among retinal neuroepithelial cells. We provide direct evidence that neurogenic progenitors have greater basal nuclei migrations during the last cell cycle preceding a terminal mitosis. In addition, we show that atypical protein kinase C (aPKC)-mediated cell polarity is essential for the relationship between nuclear position and neurogenesis. Loss of aPKC also resulted in increased proliferative cell divisions and reduced retinal neurogenesis. Our data support a novel model for neurogenesis, in which interkinetic nuclear migration differentially positions nuclei in neuroepithelial cells and therefore influences selection of progenitors for cell cycle exit based on apical-basal polarized signals.


Figures

Figure 1.
Figure 1.
Interkinetic nuclear migration in neuroepithelial cells and heterogeneity in the location of nuclei during the cell cycle. A, Neuroepithelial cells move their nuclei in an apical-to-basal manner with reference to the cell cycle. M phase always occurs at the apical surface, whereas G1, S, and G2 phases occur at more basal locations. Intrinsic and extrinsic factors change over time in addition to localizing within different regions of neuroepithelial cells (colored background). In this diagram, the black cell produces a postmitotic neuron. After the neurogenic division, one of the daughter cells (gray) exits the cell cycle to become a ganglion cell (red). B, Phospho-Rb immunolabeling (red) indicates that nuclei in late G1/early S phase are distributed throughout the neuroepithelium. C, Phospho-histone H3 immunolabeling (red) indicates that nuclei in late G2/M phase are restricted to the apical surface. D, S-phase nuclei (red) labeled with a 5 min pulse of BrdU also show heterogeneity in apical–basal location. huc:GFP expression marks differentiating retinal ganglion cells at the basal surface (green). B–D, Images are from 36 hpf zebrafish embryos. E, S-phase nuclei (red) labeled with a 15 min pulse of BrdU at E10.5 of a mouse embryo also show heterogeneity in apical–basal location. B–E, Bright-field images overlaid with confocal fluorescence. RPE, Retinal pigment epithelium.
Figure 2.
Figure 2.
Examining interkinetic nuclear migration in vivo. A, Isolated, labeled retinal neuroepithelial cells were generated by blastula transplantation. Donor cells, derived by crossing a homozygous H2A-GFP transgenic fish to a homozygous huc:GFP fish, were then placed in the retinal-fated region of unlabeled host blastula-stage embryos. B, Montage of selected frames from a time-lapse imaging experiment showing the heterogeneity of interkinetic nuclear migration. Duplicated nuclei of a cell in late M phase, as well as that of their progeny, are pseudocolored red and yellow. Also shown is a separate clone with green nuclei. Dashed lines indicate the apical (top) and basal (bottom) surfaces. Developmental time (hpf) is shown above the lens (bottom right). C, Diagram showing the parameters of interkinetic nuclear migration that were quantified: (1) cell cycle period, (2) basal pause time, and (3) maximum basal distance achieved. D, Graph of interkinetic nuclear migration in an individual cell and its progeny. A single cell's nuclei (black) and its progeny (light and dark blue) were tracked until they were lost as a result of high cell density in the imaging field or until photobleaching occurred. Heterogeneity is evident between daughter cells for cell cycle period, basal pause time, and maximum basal position. Note the saltatory nature and occasional reverse in direction for nuclear migration.
Figure 3.
Figure 3.
Interkinetic nuclear migration is heterogeneous, and parameters are independent. A–C, Frequency distributions of cell cycle period (A), basal pause time (B), and maximum basal distance achieved (C) for interkinetic nuclear migration in retinal neuroepithelial cells from 24–40 hpf embryos (n = 109 cells from 16 independent time lapses). D–F, Scatter plots showing the independent variable relationship of cell cycle period versus basal pause time (D), maximum basal position versus cell cycle period (E), and maximum basal position versus basal pause time (F). Regression analysis using the Pearson correlation and Spearman rank correlation demonstrates a lack of strong dependence for any of the parameters measured. The Spearman rank correlation value (r), where 1 equals absolute correlation, is shown for each comparison (top right).
Figure 4.
Figure 4.
Interkinetic nuclear migration: proliferative versus neurogenic cell divisions. A, Lineage diagrams of four representative huc:GFP transgenic retinal families indicating the cell type [proliferative (green circles), postmitotic neuron (red squares), or unknown (black triangles)] and the associated cell cycle period (vertical time, h:min). AI, Lineage showing symmetric proliferative cell divisions. AII, Lineage showing a single asymmetric division in the first generation. AIII, Lineage showing two asymmetric divisions in the second generation. AIV, Lineage showing two symmetric proliferative divisions in the second generation that produced an asymmetric neurogenic and symmetric neurogenic division. Note that cell cycle period does not always increase in subsequent cell generations (AIV). B, Maximum basal position of proliferative (green circles) and postmitotic neurons (red squares) as measured in huc:GFP fish (p = 0.014, Wilcoxon test). C, Maximum basal position of proliferative (green circles) and postmitotic neurons (red squares) as measured in ath5:GFP fish (p = 0.00005, Wilcoxon test). The proportion of neurogenic cells based on maximum apical–basal nucleus position is shown to the right of each graph. Note the increased probability of a neurogenic cell division correlates with the depth of nuclear migration.
Figure 5.
Figure 5.
TSA-treated nuclei do not become neurogenic and behave similarly to definitive proliferative nuclei. A, DMSO-treated control and TSA-treated (1 μm) retinas at 36 hpf. Control retinas have a large proportion of cells expressing the postmitotic huc:GFP marker indicating neurogenesis, whereas the TSA-treated embryos have no neurogenesis occurring in the retina. Note that the TSA-treated embryo does have differentiation of huc:GFP-expressing cells in other brain regions. B, Maximum basal nuclei position of DMSO-treated (open triangles) and TSA-treated (filled diamonds) embryos. C, Average cell cycle period for DMSO- (n = 5) or TSA- (n = 5) treated embryos. These populations of cells are not statistically different for either parameter. N, Nasal epithelium. The arrows indicate ventral fissure and site of initiation of neurogenesis in the retina.
Figure 6.
Figure 6.
aPKC activity is essential for the relationship between nuclear position and neurogenesis. A, Developmental time for initiation of neurogenesis as marked by huc:GFP expression in wild-type versus has/aPKCλ mutants and control versus aPKCλ and ζ morphants. B, Saturation BrdU (red) and Hoechst (blue) labeling to identify postmitotic neurons at 34 hpf in wild type, has mutants, and aPKCλ and ζ morphants. The arrowheads indicate BrdU-negative, postmitotic cells. C, Comparison of the proportion of postmitotic cells at 34 hpf in wild type, has mutants, and aPKCλ and ζ morphants. **p < 0.01, Student's t test. D, Maximum basal position of proliferative (green circles) and postmitotic neurons (red squares) as measured in ath5:GFP;aPKCλ and ζ morphant cells. There is no significant difference between the proliferative and neurogenic populations (p = 0.525, Wilcoxon test). The wild-type range of maximum basal nuclear positions for neurogenic and proliferative retinal cells is regraphed from Figure 4 C for comparison. Error bars represent SEM.
Figure 7.
Figure 7.
Model depicting the influence of interkinetic nuclear migration on neurogenesis. Two neurogenic-competent cells (white nuclei) are shown to have just exited M phase. Heterogeneity in interkinetic nuclear migration results in differential location and time that the nucleus resides in G1 and/or G2 phase for otherwise equivalent cells (red box). Localized intrinsic and extrinsic cues, which change with developmental time (background colors), provide differential influences on the retinal progenitors. Although both progenitors are competent to produce a postmitotic cell, only those with greater basal nuclear migrations are selected to become neurogenic (gray nuclei). M-phase dynamics regulate which cell(s) become postmitotic (red nuclei) and influence cell-type fate.

Similar articles

Cited by

References

    1. Alexiades MR, Cepko C. Quantitative analysis of proliferation and cell cycle length during development of the rat retina. Dev Dyn. 1996;205:293–307. - PubMed
    1. Baye LM, Link BA. Nuclear migration during retinal development. Brain Res. 2007 in press. - PMC - PubMed
    1. Biehlmaier O, Neuhauss SC, Kohler K. Onset and time course of apoptosis in the developing zebrafish retina. Cell Tissue Res. 2001;306:199–207. - PubMed
    1. Calegari F, Huttner WB. An inhibition of cyclin-dependent kinases that lengthens, but does not arrest, neuroepithelial cell cycle induces premature neurogenesis. J Cell Sci. 2003;116:4947–4955. - PubMed
    1. Calegari F, Haubensak W, Haffner C, Huttner WB. Selective lengthening of the cell cycle in the neurogenic subpopulation of neural progenitor cells during mouse brain development. J Neurosci. 2005;25:6533–6538. - PMC - PubMed

Publication types