. 2007 Dec;18(12):4698-710.
doi: 10.1091/mbc.e07-02-0098. Epub 2007 Sep 19.

Late endosomal traffic of the epidermal growth factor receptor ensures spatial and temporal fidelity of mitogen-activated protein kinase signaling

Affiliations

Late endosomal traffic of the epidermal growth factor receptor ensures spatial and temporal fidelity of mitogen-activated protein kinase signaling

N Taub et al. Mol Biol Cell. 2007 Dec.

Abstract

Mitogen-activated protein kinase (MAPK) signaling is regulated by assembling distinct scaffold complexes at the plasma membrane and on endosomes. Thus, spatial resolution might be critical to determine signaling specificity. Therefore, we investigated whether epidermal growth factor receptor (EGFR) traffic through the endosomal system provides spatial information for MAPK signaling. To mislocalize late endosomes to the cell periphery we used the dynein subunit p50 dynamitin. The peripheral translocation of late endosomes resulted in a prolonged EGFR activation on late endosomes and a slow down in EGFR degradation. Continuous EGFR signaling from late endosomes caused sustained extracellular signal-regulated kinase and p38 signaling and resulted in hyperactivation of nuclear targets, such as Elk-1. In contrast, clustering late endosomes in the perinuclear region by expression of dominant active Rab7 delayed the entry of the EGFR into late endosomes, which caused a delay in EGFR degradation and a sustained MAPK signaling. Surprisingly, the activation of nuclear targets was reduced. Thus, we conclude that appropriate trafficking of the activated EGFR through endosomes controls the spatial and temporal regulation of MAPK signaling.


Figures

Figure 1.
Figure 1.
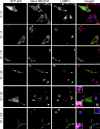
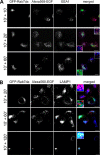
The late endosomal compartment is mislocalized to the cell periphery in p50-overexpressing cells. (A) Distribution of the endosomal system in normal (left) and in p50-overexpressing cells (right). (B) Confocal images of GFP-p50 (green)-expressing cells and control cells. Top, indirect immunofluorescence analysis was performed using LAMP1 antibody (red). Bottom, incubation with LysoTracker (red) for 30 min. Arrows indicate the peripheral distribution of late endosomes/lysosomes in p50-expressing cells. Triangles indicate the perinuclear distribution in control cells. Bars, 10 μm. (C) Demonstration of the distribution of late endosomes in control and GFP-p50–expressing cells. Black bars represent peripheral distribution, and white bars represent perinuclear distribution of LAMP1-positive structures; 92.3% exhibited peripheral and 7.7% perinuclear distribution in GFP-p50 cells versus 0.3% exhibited peripheral and 99.7% perinuclear distribution of LAMP1-positive structures in control cells. Mean ± SD of three independent experiments is indicated. (D) Peripherally mislocalized LAMP1- and EEA1-positive compartments represent different subpopulations of organelles. Confocal images of control cells and HeLa cells expressing GFP-p50 (green) are shown. Cells were subjected to indirect immunofluorescence analysis by using anti-EEA1 (red) and anti-LAMP-1 (blue) antibody. High-magnification views are shown in the rectangles. Bar, 10 μm.
Figure 2.
Figure 2.
EGF is transported to peripherally mislocalized LAMP1-positive structures. HeLa cells expressing GFP-p50 were serum-deprived for 14 h. Cells were preincubated with DMEM containing Alexa586-labeled EGF (100 ng/ml) for 1 h at 4°C (referred to as 0′+0′). Cells were stimulated for 10 min at 37°C (pulse) followed by a 0-, 10-, 20-, 60-, and 120-min chase in DMEM in the absence of EGF. Cells were subjected to indirect immunofluorescence analysis by using an antibody against LAMP1 and analyzed by triple channel fluorescence microscopy. p50-positive cells are shown in green, EGF in red, and LAMP1 in blue. Confocal images are shown. High-magnification views are shown in the rectangles. Bars, 10 μm.
Figure 3.
Figure 3.
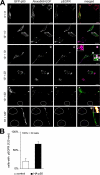
p50 overexpression results in a prolonged EGFR activation on peripherally mislocalized endosomes. (A) HeLa cells expressing GFP-p50 were pretreated as described in Figure 2, and they were labeled with an antibody against the activated EGFR (blue). Confocal images are shown. High-magnification views are shown in the rectangles. Bars, 10 μm. (B) The graph demonstrates the presence of the activated EGFR after 10 min of EGF pulse and 120 min of chase in GFP-p50–expressing HeLa cells (black) and control cells (white); 67% of GFP-p50–expressing cells exhibited activated EGFR after 120 min of chase, whereas only 20% in control cells; 100% are equivalent to 50 cells. Mean ± SD of three independent experiments is indicated.
Figure 4.
Figure 4.
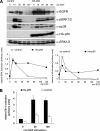
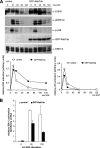
Spatial redistribution of EGFR signaling changes the activation pattern of MAPK signaling pathways. (A) p50 changes the activation pattern of cytoplasmic MAPK signaling targets. HeLa cells were transiently transfected with HA-p50 or left untreated. After 14-h serum deprivation, cells were stimulated with 100 ng/ml EGF for the indicated times. Cell lysates were separated by SDS-PAGE and probed with the indicated antibodies. The graphs show a densitometric analysis of the p-ERK1/2 and p-p38. One representative experiment of three is shown. (B) p50 overexpression influences nuclear targets. A stable Elk-1–driven luciferase reporter cell line was transfected with HA-p50 or with an empty vector. Cells were stimulated for the indicated times (0, 20, and 120 min) with EGF (100 ng/ml) or left untreated. One aliquot of the cell extract was used to measure the luciferase activity. The other aliquot was used to control protein expression and total protein amounts by immunoblotting. Each time point was performed twice and measured in triplets. One representative experiment of three is shown. The relative light units are normalized to protein amount.
Figure 5.
Figure 5.
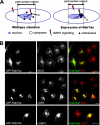
GFP-Rab7da–expressing cells show a tight clustering of the late endosomal compartment in the perinuclear region. (A) Distribution of the endosomal system in normal (left) and in GFP-Rab7da–overexpressing cells (right). (B) Confocal images of untransfected and GFP-Rab7da (green)–expressing HeLa cells are shown. Cells were subjected to indirect immunofluorescence using antibodies against EEA1 (red), LAMP1 (red), and LBPA (red). Bars, 10 μm.
Figure 6.
Figure 6.
GFP-Rab7da–expressing cells show a delayed transport of EGF from the EEA1 to the LAMP1-positive structures. (A) HeLa cells expressing GFP-Rab7da were pretreated as described in legend to Figure 2, and they were labeled with an antibody against EEA1 (blue). Chase periods of 10, 20, and 60 min are displayed. Confocal images are shown. High-magnification views are shown in the rectangles. Bars, 10 μm. (B) HeLa cells expressing GFP-Rab7da were pretreated as described in legend to Figure 2, and they were labeled with an antibody against LAMP1 (blue). Chase periods of 20, 60, and 120 min are displayed. Confocal images are shown. High-magnification views are shown in the rectangles. Bars, 10 μm.
Figure 7.
Figure 7.
GFP-Rab7da–expressing cells showed a delayed p-EGFR transport to tightly clustered perinuclear endosomes. (A) HeLa cells expressing GFP-Rab7da were serum-deprived for 14 h. Cells were preincubated with DMEM containing Alexa568-labeled EGF for 1 h at 4°C, and then they were stimulated for 10 min at 37°C (pulse), followed by a 0-, 10-, 20-, 60-, and 120-min chase in DMEM. In the absence of EGF, cells were subjected to indirect immunofluorescence analysis by using an antibody against p-EGFR, and they were analyzed by triple-channel fluorescence microscopy. Rab7da-positive cells are shown in green, EGF internalization in red, and activated EGFR in blue. Confocal images are shown. High-magnification views are shown in the rectangles. Bars, 10 μm. (B) The graph shows the presence of the activated EGFR in HeLa cells expressing GFP-Rab7da and in control cells after a 10-min EGF pulse and 120-min chase; 84% of GFP-Rab7da–expressing cells exhibited activated EGFR after 120-min chase, whereas only 9% in control cells; 100% are equivalent to 100 cells. SD of three independent experiments is indicated.
Figure 8.
Figure 8.
A delay in EGFR transport due to a tightly clustering of the late endosomal compartment changes the activation pattern of MAPK signaling pathways. (A) HeLa cells were transiently transfected with GFP-Rab7da or left untreated. After 14-h serum deprivation, cells were stimulated with 100 ng/ml EGF for the indicated times. Cell lysates were separated by SDS-PAGE and probed with the indicated antibodies. The graphs show a densitometric analysis of the p-ERK1/2 and p-p38. One representative experiment of three is shown. (B) HeLa cells expressing GFP-Rab7da were treated as described in Figure 4B. Each time point was performed twice and measured in triplets. One representative experiment of three is shown. Relative light units are normalized to protein amount.
Figure 9.
Figure 9.
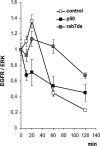
HA-p50– and GFP-Rab7da–expressing cells display an altered EGFR degradation. HeLa cells were transiently transfected with GFP-Rab7da, HA-p50, or left untreated. After 14-h serum deprivation, cells were stimulated with 100 ng/ml EGF for the indicated times. Cell lysates were separated by SDS-PAGE and probed with EGFR and ERK antibodies. The graphs show a densitometric analysis of the EGFR levels adjusted to the corresponding ERK levels and normalized to the levels of the control cells at time point 0. HA-p50 and GFP-Rab7da cells showed a 2.4-fold and 1.4-fold increase in EGFR levels, respectively, compared with control cells. SE is indicated of five (HA-p50), seven (GFP-Rab7da), and 11 (control) independent experiments.
Figure 10.
Figure 10.
Immuno-EM of HeLa cells overexpressing (A) GFP-p50 or (B) GFP-Rab7da after 120 min of EGF stimulation. (A) p50-expressing cells show colocalization of EGFR (5-nm gold, marked by arrows) and LAMP1 (10-nm gold) at the boundary of and inside late endosomes/lysosomes. Cytoplasmic labeling of p50-GFP within the same cell locates outside the frame shown here. The neighboring multivesicular body (marked by asterisk) is free of labeling upon 120 min of EGF stimulation. Bar, 100 nm. (B) Rab7da-overexpressing cells also show EGFR labeling clearly within Rab7da-positive late endosomes/lysosomes upon 120 min of EGF stimulation (EGFR, 5-nm gold, arrows; GFP, 20-nm gold). Bar, 100 nm.

References

    1. Adachi T., Kar S., Wang M., Carr B. I. Transient and sustained ERK phosphorylation and nuclear translocation in growth control. J. Cell Physiol. 2002;192:151–159. - PubMed
    1. Bache K. G., Stuffers S., Malerod L., Slagsvold T., Raiborg C., Lechardeur D., Walchli S., Lukacs G. L., Brech A., Stenmark H. The ESCRT-III subunit hVps24 is required for degradation but not silencing of the epidermal growth factor receptor. Mol. Biol. Cell. 2006;17:2513–2523. - PMC - PubMed
    1. Bohn G., et al. A novel human primary immunodeficiency syndrome caused by deficiency of the endosomal adaptor protein p14. Nat. Med. 2007;13:38–45. - PubMed
    1. Bucci C., Thomsen P., Nicoziani P., McCarthy J., van Deurs B. Rab 7, a key to lysosome biogenesis. Mol. Biol. Cell. 2000;11:467–480. - PMC - PubMed
    1. Buchwalter G., Gross C., Wasylyk B. Ets ternary complex transcription factors. Gene. 2004;324:1–14. - PubMed

Publication types

MeSH terms