. 2007 Nov;43(5):636-47.
doi: 10.1016/j.yjmcc.2007.07.062. Epub 2007 Aug 10.

Sodium channel Scn1b null mice exhibit prolonged QT and RR intervals

Affiliations

Sodium channel Scn1b null mice exhibit prolonged QT and RR intervals

Luis F Lopez-Santiago et al. J Mol Cell Cardiol. 2007 Nov.

Abstract

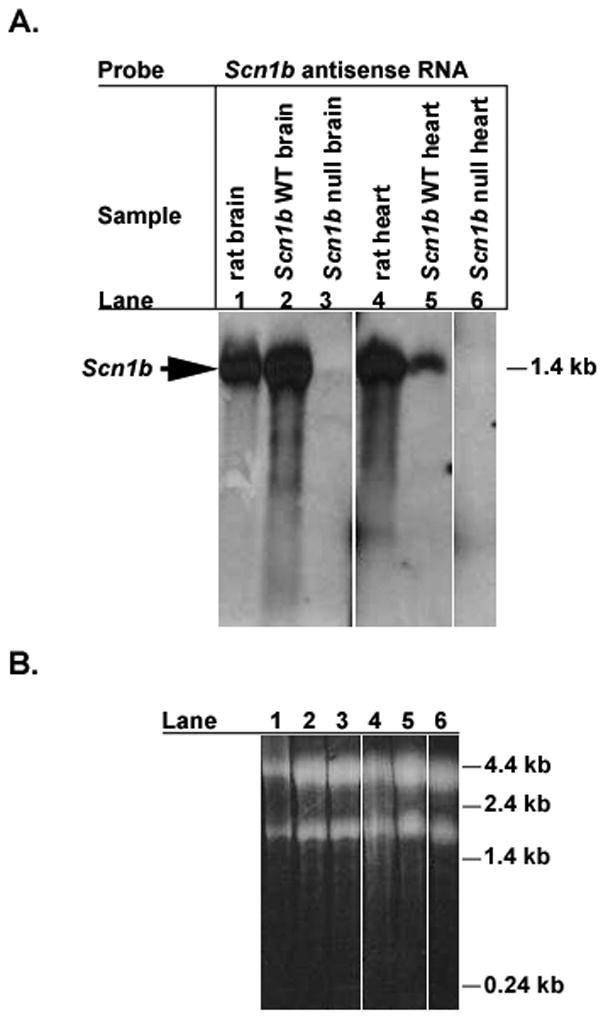
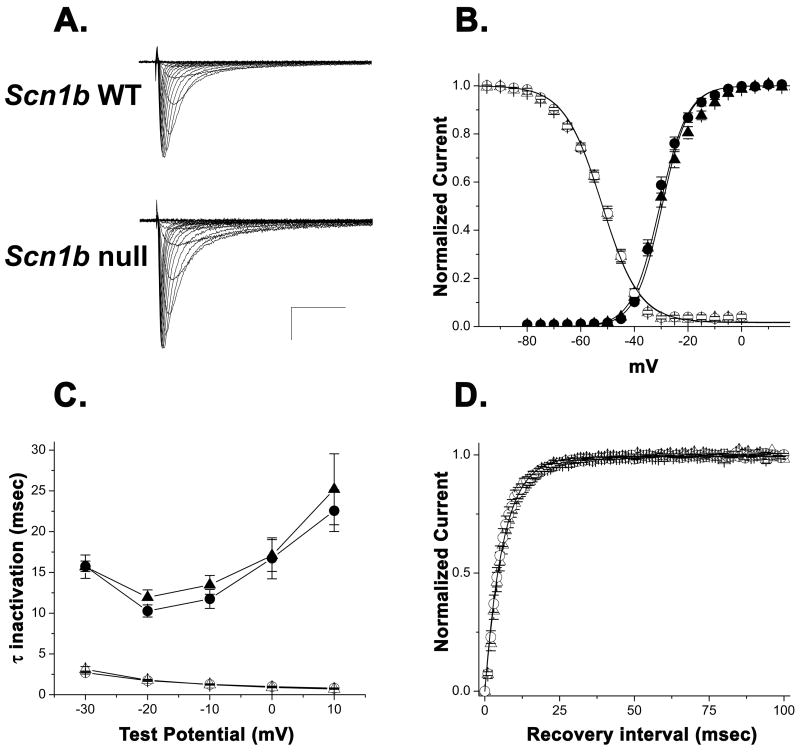
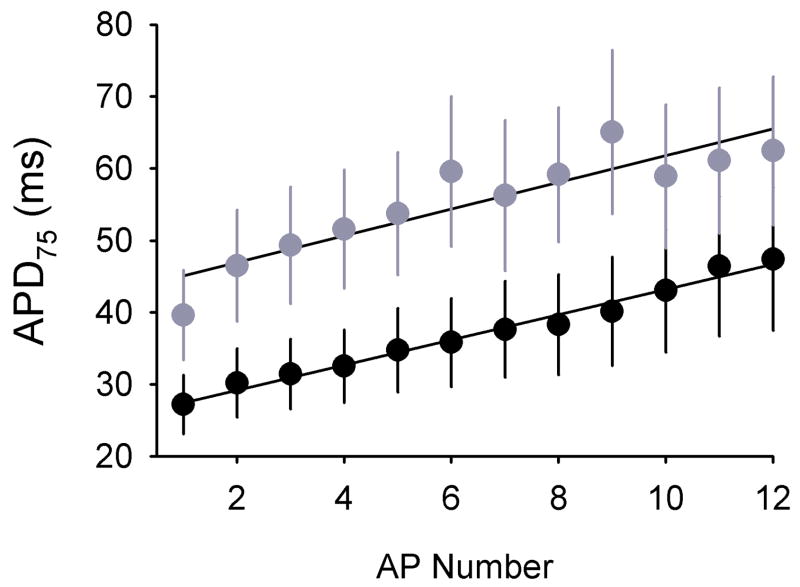
In neurons, voltage-gated sodium channel beta subunits regulate the expression levels, subcellular localization, and electrophysiological properties of sodium channel alpha subunits. However, the contribution of beta subunits to sodium channel function in heart is poorly understood. We examined the role of beta1 in cardiac excitability using Scn1b null mice. Compared to wildtype mice, electrocardiograms recorded from Scn1b null mice displayed longer RR intervals and extended QT(c) intervals, both before and after autonomic block. In acutely dissociated ventricular myocytes, loss of beta1 expression resulted in a approximately 1.6-fold increase in both peak and persistent sodium current while channel gating and kinetics were unaffected. Na(v)1.5 expression increased in null myocytes approximately 1.3-fold. Action potential recordings in acutely dissociated ventricular myocytes showed slowed repolarization, supporting the extended QT(c) interval. Immunostaining of individual myocytes or ventricular sections revealed no discernable alterations in the localization of sodium channel alpha or beta subunits, ankyrin(B), ankyrin(G), N-cadherin, or connexin-43. Together, these results suggest that beta1 is critical for normal cardiac excitability and loss of beta1 may be associated with a long QT phenotype.


Figures

Fig. 1
Fig. 1. Northern blot analysis of Scn1b null brain and heart
Total RNA was isolated from adult rat brain, adult rat heart, P17-18 Scn1b wildtype brain, P17-18 Scn1b wildtype heart, P17-18 Scn1b null brain, and P17-18 Scn1b null heart, as indicated in panel A. Equal aliquots of RNA (10 μg for brain samples, lanes 1–3; 20 μg for heart samples, lanes 4–6) were separated on agarose-formaldehyde gels and probed with a digoxigenin-labeled antisense Scn1b mRNA probe. A. Northern blot. Arrow indicates position of ~1.4 kilobase band corresponding to Scn1b. B. Ethidium bromide stained gel prior to transfer of RNA, showing approximately equal loading of RNA samples. 18S and 28S ribosomal RNAs are stained.
Fig. 2
Fig. 2. Comparison of INa recorded from Scn1b wildtype and null ventricular myocytes
A. Representative INa densities recorded fromScn1b wildtype and null myocytes. Test pulses from −80 to +20 mV, with step of 5 mV. Scale bar: 15 pA/pF and 10 ms. B. Mean activation (filled symbols) and inactivation (open symbols) curves for INa from Scn1b wildtype mice (circles; Activation: V½ = −30.51 ± 0.6 mV, k = −5.17 ± 0.31 mV, n = 13 cells from 9 mice; Inactivation: V½ = −52.14 ± 0.59, k = 7.07 ± 0.15, n = 12 cells from 9 mice) and Scn1b null mice (triangles; Activation: V½ = −29.70 ± 1.0 mV, k = −5.00 ± 0.77 mV, n = 17 cells from 12 mice; Inactivation: V½ = −52.12 ± 0.82, k = 7.02 ± 0.16, n = 15 cells from 11 mice). Smooth lines were generated by the Boltzmann equation using mean values for V½ and k determined from fits of individual experiments. C. Current inactivation kinetics as a function of voltage. Mean fast (τfast, open symbols) and slow (τslow closed symbols) time constants of inactivation. D. Recovery from inactivation. Smooth lines represent a single exponential generated from the mean τrec values determined from fits of individual experiments. For Scn1b wildtype, τrec = 6.14 ± 0.57 ms, n = 8 cells from 5 mice. For Scn1b null τrec = 6.52 ± 0.60 ms, n = 5 cells from 5 mice. For B–D, data from Scn1b wildtype and null mice are represented by circles and triangles, respectively. Inactivation kinetics are summarized in Table 1. *p ≤ 0.05 from Student’s t-test. For this and subsequent figures, error bars show SEM.
Fig. 3
Fig. 3. Loss of β1 results in increased INa and INaP densities, increased 3H-STX binding, and increased Scn5a expression
A. Average peak INa from ventricular myocytes. Scn1b wildtype (WT) = −33.9 ± 3.2 pA/pF; Scn1b null = −53.6 ± 6.6 pA/pF. Inset for panel A, typical INa traces (test pulse to −20 mV) corrected for cell capacitance recorded from Scn1b null myocytes (left) and Scn1b wildtype myocytes (right). Scale bar: 10 pA/pF and 2.5 ms. B. INaP from ventricular myocytes. Scn1b wildtype = −0.29 ± 0.04 pA/pF; Scn1b null = −0.46 ± 0.05* pA/pF. Membrane capacitance: Scn1b wildtype = 74.2 ± 5.0 pF, Scn1b null = 52.9 ± 4.1* pF. For Scn1b wildtype n = 13 cells from 9 mice. For Scn1b null n = 17 cells from 12 mice. Inset for panel B, zoomed image of the traces shown in the inset to panel A, showing the current from 50–100 ms following the depolarizing pulse. Solid lines represent averaged amplitudes for this time segment, similar to the analysis performed in B. Scale bar: 0.5 pA/pF and 5 ms. C. Specific [3H]-STX binding (Scn1b wildtype: 18.9 ± 4.2 fmol/mg protein, n = 3; Scn1b null: 35.3 ± 4.4* fmol/mg protein, n = 3) in homogenized ventricular myocytes. *p ≤ 0.05 for Scn1b wildtype vs. Scn1b null. D. Upper panel: Scn5a mRNA expression levels in Scn1b heterozygous (+/−, n = 6) and null (−/−, n = 7) heart tissue compared to wildtype (+/+) littermates (normalized to 1, n =7) using the ΔΔCt method to determine fold expression levels and Single Factor ANOVA to determine significance. Scn5a expression is 151% of wildtype in Scn1b null (*p = 0.002) and ~100% in Scn1b heterozygous mice. Lower panel: Western blots of heart membranes prepared from 3 sets of Scn1b wildtype (+/+) and Scn1b null (−/−) littermate pairs showing an increase in Nav1.5 protein in Scn1b null heart (133% of wildtype, p = 0.03). Each lane represents protein from one mouse.
Fig. 4
Fig. 4. Action potentials are prolonged in Scn1b null myocytes
APD75 values were measured in isolated Scn1b wildtype (n=14) and null (n=15) ventricular myocytes in response to stimulation at a cycle length of 150 ms. Solid lines are linear fits to the data. Analysis of the data using two-way ANOVA shows a significant (p < 0.0001) increase in APD75 in Scn1b null myocytes.
Fig. 5
Fig. 5. Analysis of the rate of change in Vm for AP recordings
A. Details of an averaged trace of the first AP (150 ms CL), top panel; and the corresponding dVm/dt, bottom panel. The arrow indicates the starting point of the stimulation pulse. Vertical solid line indicates the maximal depolarizing rate and dotted line indicates the maximal repolarizing rate. Scale bars: 1.5 ms and 20 mV/ms. B. Maximum upstroke rate for the first action potential in each train for CL150 recorded from Scn1b wildtype (WT, black) or Scn1b null (Null, gray) myocytes. Analysis of the data using two-way ANOVA shows a significant (p=0.0021) decrease for Scn1b null myocytes. C. Maximum repolarization rate recorded from Scn1b wildtype (WT, black) or Scn1b null (Null, gray) myocytes for CL150 (circles) or CL300 (squares). *p < 0.05 or #p < 0.10 for Scn1b wildtype vs. Scn1b null mice.
Fig. 6
Fig. 6. Loss of β1 does not affect the localization of sodium channels or structural proteins
A, C, E, G, and I sections from Scn1b wildtype hearts. B, D, F, H, and J sections from Scn1b null hearts. A and B, Nav1.1 (green) co-localizes with α-actinin (red) at the Z-line/t-tubules in heart sections. Scale bar 50 μm. C and D, co-localization of Nav1.5 (green) with connexin-43 (Cx-43) (red) at intercalated disks (examples are shown at arrows). Scale bar 50 μm. E and F, Nav1.6 (green) and phalloidin (red) co-localize at Z-line/t-tubules. Scale bar 20 μm. G and H, co-localization of β3 (green) and phalloidin (red). Scale bar 20 μm. I and J, β4 (green) co-localizes with connexin-43 (Cx-43) (red). Scale bar 20 μm.
Fig. 7
Fig. 7. Localization of ankyrinB, ankyrinG, connexin-43, and N-cadherin in Scn1b null cardiac myocytes
A. Co-localization of ankyrinB (green) with phalloidin (red). Scale bar 100 μm. B. Co-localization of ankyrinG (green) with connexin-43 (Cx-43) (red). Scale bar 20 μm. C. Co-localization of connexin-43 (Cx-43, green) with N-cadherin (red). Scale bar 20 μm.

References

    1. Tan HL, Bezzina CR, Smits JP, Verkerk AO, Wilde AA. Genetic control of sodium channel function. Cardiovasc Res. 2003 Mar 15;57(4):961–73. - PubMed
    1. Meadows LS, Isom LL. Sodium channels as macromolecular complexes: implications for inherited arrhythmia syndromes. Cardiovascular Research. 2005;67:448–58. - PubMed
    1. Hartshorne RP, Messner DJ, Coppersmith JC, Catterall WA. The saxitoxin receptor of the sodium channel from rat brain Evidence for two nonidentical beta subunits. JBiolChem. 1982;257:13888–91. - PubMed
    1. Isom LL, De Jongh KS, Patton DE, Reber BFX, Offord J, Charbonneau H, et al. Primary structure and functional expression of the β1 subunit of the rat brain sodium channel. Science. 1992;256:839–42. - PubMed
    1. Morgan K, Stevens EB, Shah B, Cox PJ, Dixon AK, Lee K, et al. β3: An additional auxiliary subunit of the voltage-sensitive sodium channel that modulates channel gating with distinct kinetics. Proc Natl Acad Sci USA. 2000;97:2308–13. - PMC - PubMed

Publication types

Substances