. 2008 Feb;52(3):447-56.
doi: 10.1016/j.neuint.2007.08.006. Epub 2007 Aug 17.

TNF is a key mediator of septic encephalopathy acting through its receptor, TNF receptor-1

Affiliations

TNF is a key mediator of septic encephalopathy acting through its receptor, TNF receptor-1

Jessy J Alexander et al. Neurochem Int. 2008 Feb.

Abstract

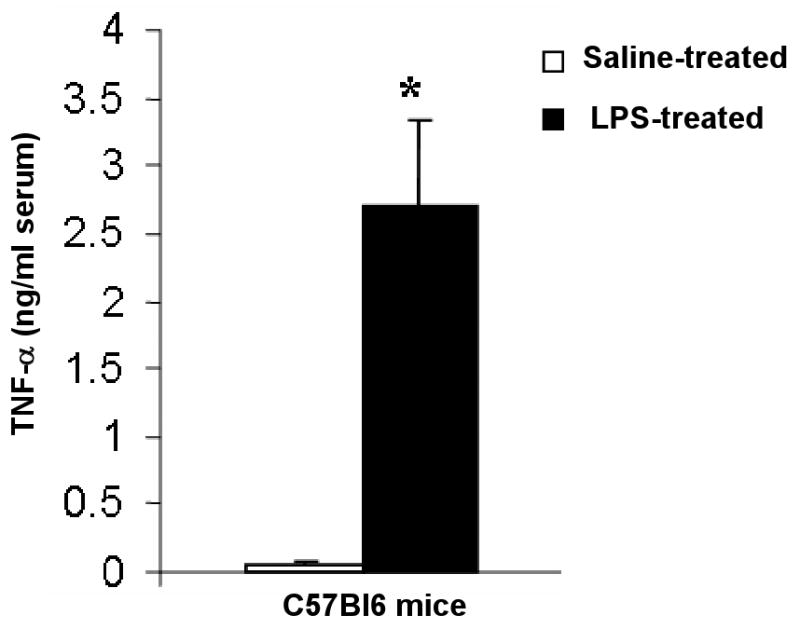
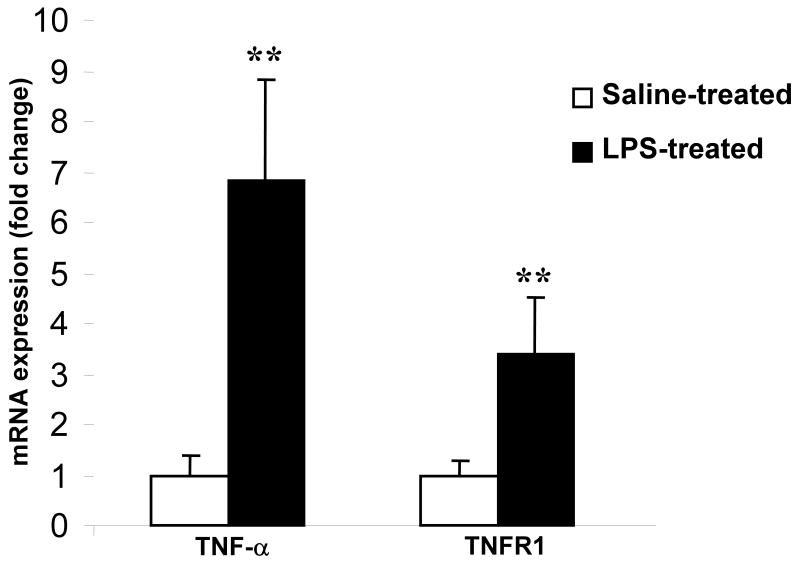
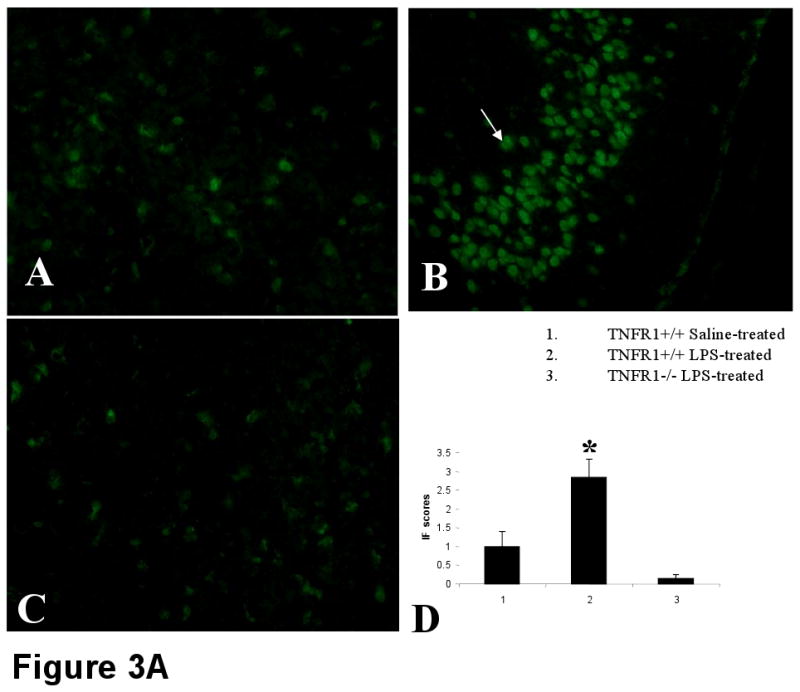
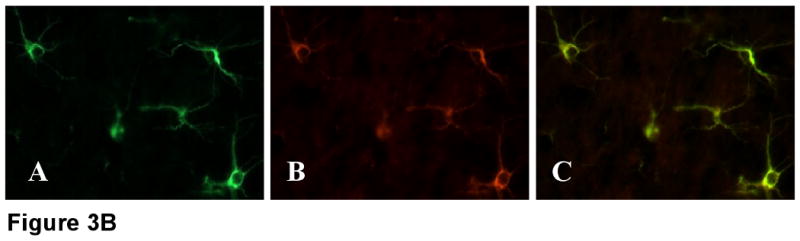
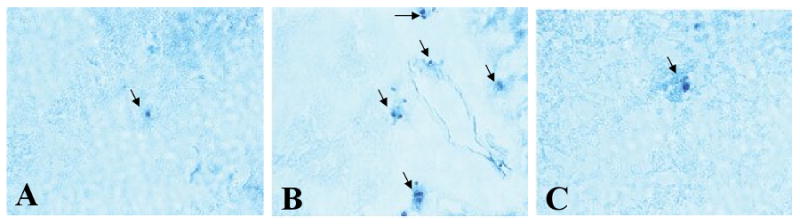
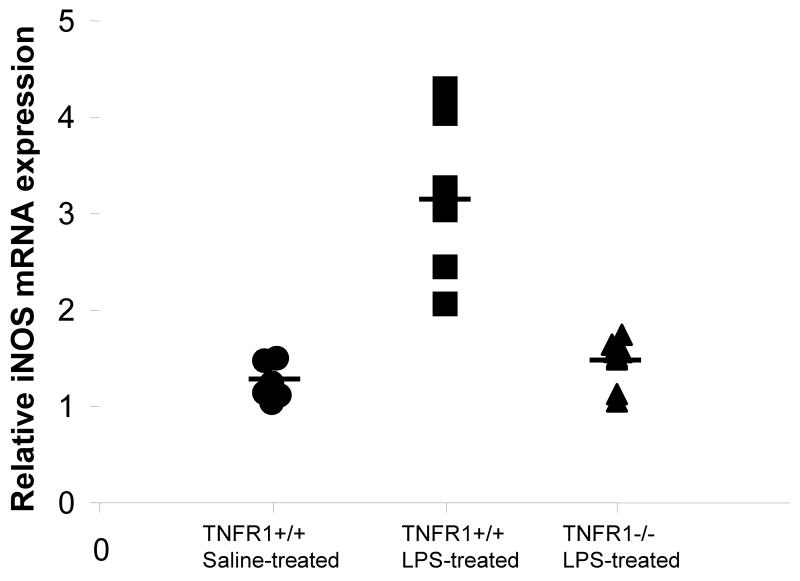
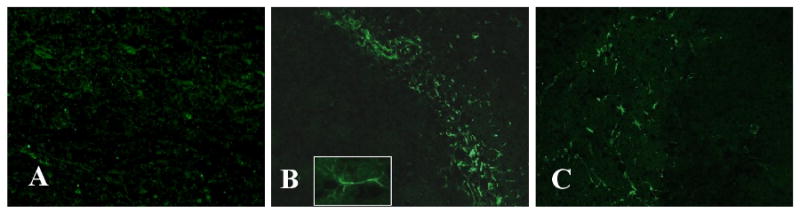
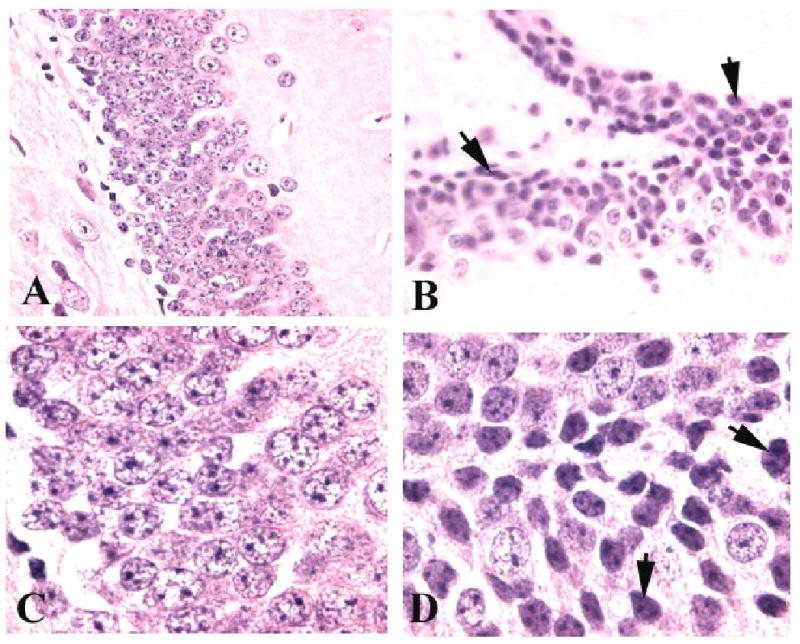
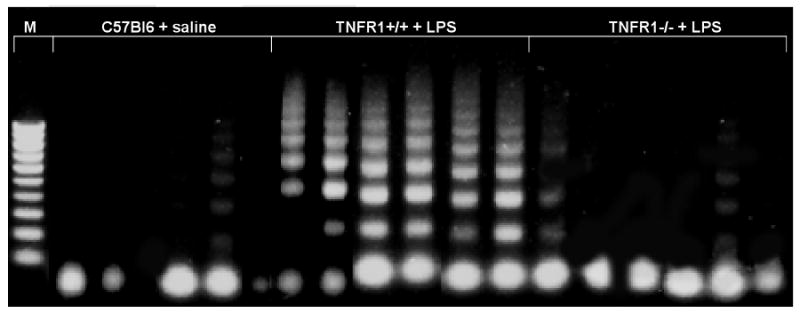
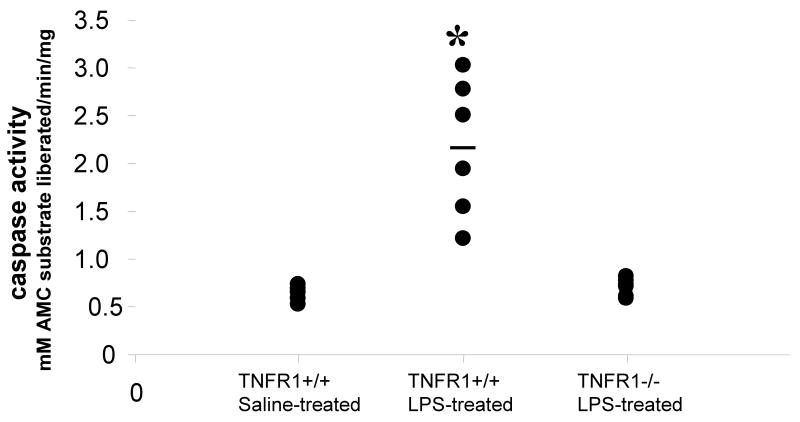
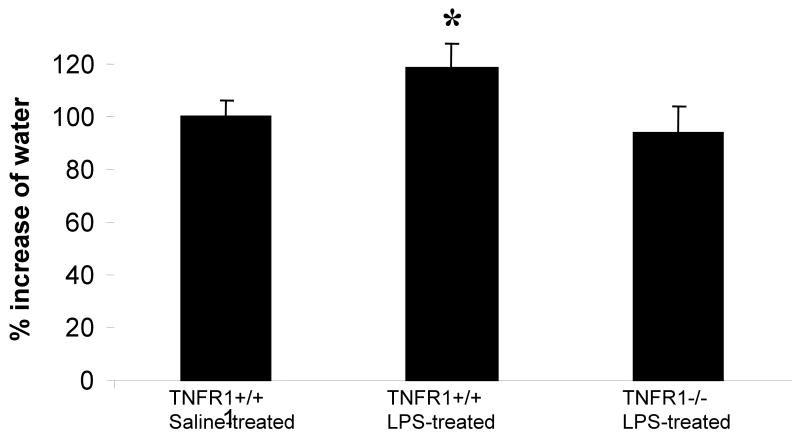
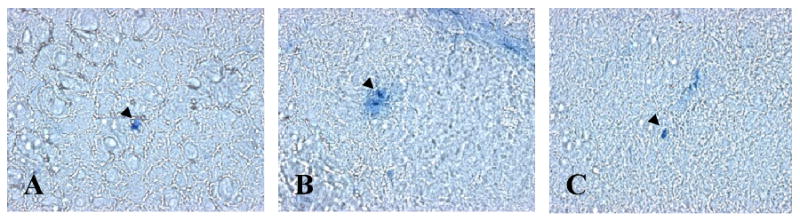
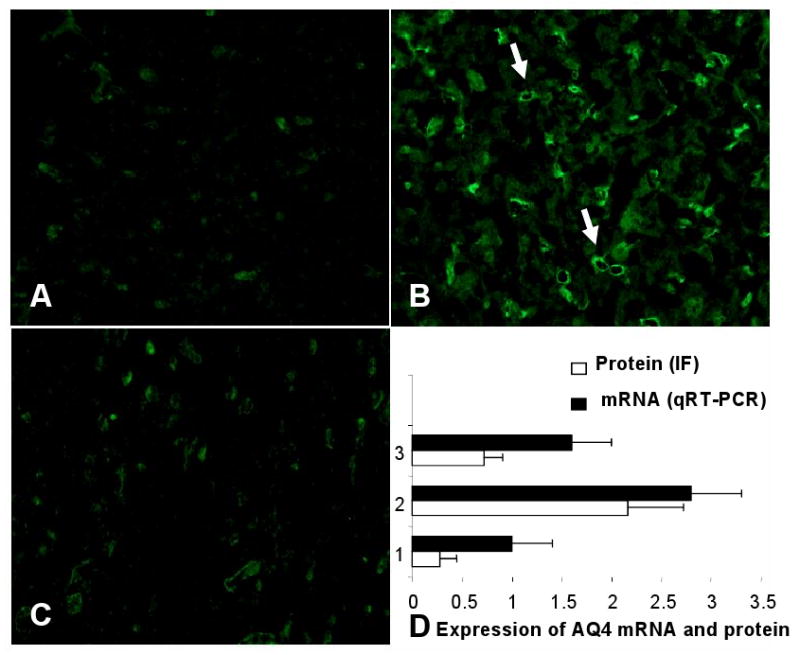
In this study, we demonstrate that mice deficient in TNFR1 (TNFR1(-/-)) were resistant to LPS-induced encephalopathy. Systemic administration of lipopolysaccharide (LPS) induces a widespread inflammatory response similar to that observed in sepsis. Following LPS administration TNFR1(-/-) mice had less caspase-dependent apoptosis in brain cells and fewer neutrophils infiltrating the brain (p<0.039), compared to control C57Bl6 (TNFR1(+/+)) mice. TNFR1-dependent increase in aquaporin (AQP)-4 mRNA and protein expression was observed with a concomitant increase in water content, in brain (18% increase in C57Bl6 mice treated with LPS versus those treated with saline), similar to cerebral edema observed in sepsis. Furthermore, absence of TNFR1 partially but significantly reduced the activation of astrocytes, as shown by immunofluorescence and markedly inhibited iNOS mRNA expression (p<0.01). Septic encephalopathy is a devastating complication of sepsis. Although, considerable work has been done to identify the mechanism causing the pathological alterations in this setting, the culprit still remains an enigma. Our results demonstrate for the first time that endotoxemia leads to inflammation in brain, with alteration in blood-brain barrier, up-regulation of AQP4 and associated edema, neutrophil infiltration, astrocytosis, as well as apoptotic cellular death, all of which appear to be mediated by TNF-alpha signaling through TNFR1.


Figures

FIGURE 1
FIGURE 1. TNF-α is significantly increased in circulation by LPS-treatment
Serum TNF-α was determined by ELISA. At baseline, circulating levels of TNF-α were undetectable using a sensitive ELISA technique. Two h after LPS injection, there was a profound (25 fold) increase in serum TNF-α. n = 6 per group. *p < 0.001 vs saline-treated.
FIGURE 2
FIGURE 2. Upregulated brain mRNA expression of TNF-α and its receptor, TNFR1 in endotoxemia
mRNA expression of TNF-α and TNFR1 were quantified by qRT-PCR and normalized to expression of GAPDH. Systemic administration of LPS caused a significant increase in expression of TNF- α (7 fold) and TNFR1 (4 fold), n = 6 per group. *p < 0.01 vs. saline-treated.
FIGURE 3
FIGURE 3
FIGURE 3A. LPS administration significantly up regulates TNFR1 expression, by immunofluorescence. Representative sections immunostained with anti-TNFR1 followed by FITC-labeled anti-hamster antibody show increased expression of TNFR1 mainly in the hippocampus and cortex of LPS-treated mice (B). Reduced TNFR1 expression was observed in mice receiving saline (A). No TNFR1 expression is apparent in LPS-induced TNFR1-/- mice (C). n=6 in each group. Magnification = 20×. Setting of the microscope was kept strictly unaltered while examining the different groups. The stained sections were scored from 0-4 and the results are given in (D). FIGURE 3B. Dual staining for GFAP (A) and TNFR1 (B) and merge (C) indicate colocalization. TNFR1 is present on the surface of the astrocytes. Magnification, 40× under oil.
FIGURE 3
FIGURE 3
FIGURE 3A. LPS administration significantly up regulates TNFR1 expression, by immunofluorescence. Representative sections immunostained with anti-TNFR1 followed by FITC-labeled anti-hamster antibody show increased expression of TNFR1 mainly in the hippocampus and cortex of LPS-treated mice (B). Reduced TNFR1 expression was observed in mice receiving saline (A). No TNFR1 expression is apparent in LPS-induced TNFR1-/- mice (C). n=6 in each group. Magnification = 20×. Setting of the microscope was kept strictly unaltered while examining the different groups. The stained sections were scored from 0-4 and the results are given in (D). FIGURE 3B. Dual staining for GFAP (A) and TNFR1 (B) and merge (C) indicate colocalization. TNFR1 is present on the surface of the astrocytes. Magnification, 40× under oil.
FIGURE 4
FIGURE 4. Neutrophil accumulation in the LPS-induced brain is TNFR1-dependent
(A) Few neutrophils are present in C57Bl6 brain at baseline (0.65±0.6). (B) Following injection of LPS, marked neutrophil accumulation was found in the brains of C57Bl6 mice, primarily in the cerebral cortex, which is shown (6.6±1.9). (C) TNFR1-/- mice had significantly less number of neutrophils in the brain after LPS injection (2.5±1.3). Magnification, ×200.
FIGURE 5
FIGURE 5. Expression of iNOS in LPS-induced brain is regulated by TNFR1
mRNA expression of the inflammatory mediator, iNOS, was quantified by qRT-PCR and normalized to expression of GAPDH (n=6 per group). Significant increase in expression of iNOS (*p < 0.01) was observed in LPS-treated C57Bl6 mice compared to their saline-treated counterparts. Absence of TNFR1 prevented the increase of iNOS expression in LPS-treated brain. Each data point represents an individual animal.
FIGURE 6
FIGURE 6. LPS causes activation of astrocytes partially through the actions of TNFR1
Representative brain sections immunostained with anti-GFAP show activated astrocytes in the hippocampus and cortex of LPS-treated mice (B) while there were virtually no positive cells in those receiving saline (A). Inset is an astrocyte at higher magnification. A marked reduction of these activated cells is apparent in LPS-induced TNFR1-/- mice (C). n=6 in each group. Magnification, 20×.
FIGURE 7
FIGURE 7. Endotoxemia leads to histological changes in the hippocampus
Wild type mice were given saline (A, C) or LPS (B, D) and sacrificed 8 h later for histological analyses. Shown are representative PAS stained sections, from the dentate gyrus of individual mice. Control mice showed normal architecture, while LPS-treated mice had evidence for cellular damage, as indicated by arrows. Magnifications, ×200 (A, C) and 400 (B, D).
FIGURE 8
FIGURE 8. TNFR1 deficiency significantly reduces endotoxemia-induced apoptosis in brain
DNA was isolated from brains of C57BL/6 mice treated with saline or 0.15 mg LPS and subjected to LM-PCR and apoptotic DNA laddering was studied. Significant apoptosis was observed in brains of wildtype mice 8 h after LPS injection compared to the negligible amount of apoptosis occurring at baseline (C57Bl6 brain not exposed to LPS). In contrast, the amount of apoptosis after LPS was markedly reduced in the absence of TNFR1. Each lane contains brain tissue harvested from an individual animal.
FIGURE 9
FIGURE 9. TNFR1 regulates LPS-induced caspase-3 activation in brain
Caspase- 3 activity was assayed in brains of mice given saline or LPS and sacrificed 8 h later, by means of a fluorogenic assay. LPS administration increased caspase-3 enzyme activity significantly compared with saline-treated control mice. Results are expressed in terms of mM AMC substrate liberated per minute per mg protein. The absence of TNFR1 significantly attenuated this increase, with caspase-3 activity remaining comparable to that of saline-treated controls. Data shown are from individual mice. *p< 0.001 vs. other groups.
FIGURE 10
FIGURE 10. Brain water content is increased in endotoxemia
Brain water content was measured as described in Methods. Water content of normal brain was taken as 100%. Water content in brains of mice treated with LPS was 18% above the controls. This increase in water was prevented in the absence of TNFR1, 97% of normal mice. *p < 0.01 vs. saline-treated.
FIGURE 11
FIGURE 11
Representative sections of the cerebral cortex from mice perfused with Evans blue are shown. Compared to the controls (A), diffusion of Evans blue from the microcapillaries was observed in the LPS-treated mice (B), indicating possible disruption of the BBB. This diffusion of Evans blue to the surrounding periphery was reduced in TNFR1-/- mice.
FIGURE 12
FIGURE 12. Increased brain AQP4 expression in endotoxemia is prevented by TNFR1 deficiency
Representative sections of the cerebral cortex stained for AQP4 are shown. Compared to controls given saline (A), there was significantly increased AQP4 expression in wildtype mice given LPS (B). The increase in AQP4 protein was observed especially around the small vessels as indicated by the arrows. This increase was prevented and AQP4 expression remained comparable to saline-treated controls in TNFR1-/- (C) mice. The stained sections were scored from 0-4 and the results are given in D along with mRNA expression quantified by qRT-PCR (n=6 per group). *p < 0.01 vs. other groups.

References

    1. Alexander JJ, Bao L, Jacob A, Kraus DM, Holers VM, Quigg RJ. Administration of the soluble complement inhibitor, Crry-Ig, reduces inflammation and aquaporin 4 expression in lupus cerebritis. Biochim Biophys Acta. 2003;1639:169–176. - PubMed
    1. Alexander JJ, Jacob A, Bao L, MacDonald RL, Quigg RJ. Complement-Dependent Apoptosis and Inflammatory Gene Changes in Murine Lupus Cerebritis. J Immunol. 2005;175:8312–8319. - PubMed
    1. Alexander JJ, Jacob A, Vezina P, Sekine H, Gilkeson GS, Quigg RJ. Absence of functional alternative complement pathway alleviates lupus cerebritis. Eur J Immunol. 2007;37:1691–1701. - PubMed
    1. Allan SM, Rothwell NJ. Cytokines and acute neurodegeneration. Nat Rev Neurosci. 2001;2:734–744. - PubMed
    1. Amrani Y, Lazaar AL, Hoffman R, Amin K, Ousmer S, Panettieri RA., Jr Activation of p55 tumor necrosis factor-alpha receptor-1 coupled to tumor necrosis factor receptor-associated factor 2 stimulates intercellular adhesion molecule-1 expression by modulating a thapsigargin-sensitive pathway in human tracheal smooth muscle cells. Mol Pharmacol. 2000;58:237–245. - PubMed

Publication types

MeSH terms