Review
. 2007 Oct;6(10):926-32.
doi: 10.1016/S1474-4422(07)70245-4.

Assessment of the progression of Parkinson's disease: a metabolic network approach

Affiliations
Review

Assessment of the progression of Parkinson's disease: a metabolic network approach

Thomas Eckert et al. Lancet Neurol. 2007 Oct.

Abstract

Background: Clinical research into Parkinson's disease has focused increasingly on the development of interventions that slow the neurodegeneration underlying this disorder. These investigations have stimulated interest in finding objective biomarkers that show changes in the rate of disease progression with treatment. Through radiotracer-based imaging of nigrostriatal dopaminergic function, a specific class of biomarkers to monitor the progression of Parkinson's disease has been identified, and these biomarkers were used in the clinical trials of drugs with the potential to modify the course of the disease. However, in some of these studies there was discordance between the imaging outcome measures and blinded clinical ratings of disease severity. Research is underway to identify and validate alternative ways to image brain metabolism, through which the efficacy of new therapies for Parkinson's disease and related disorders can be assessed.

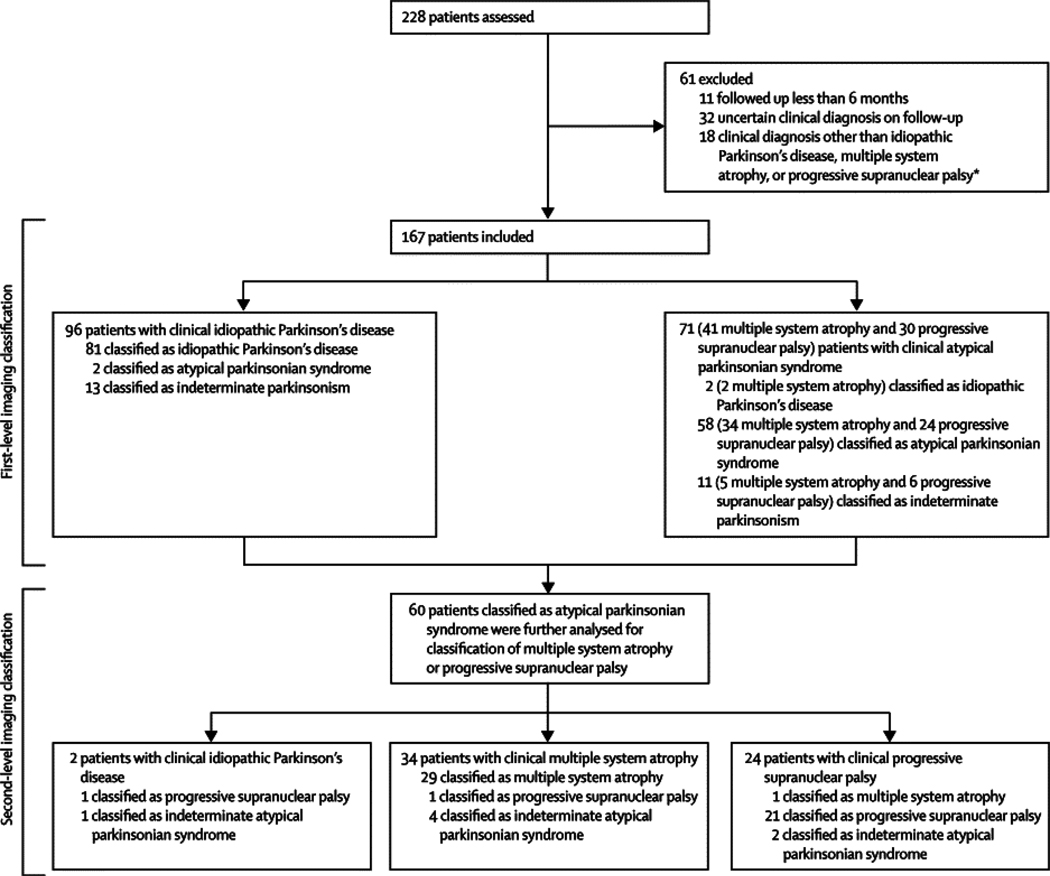
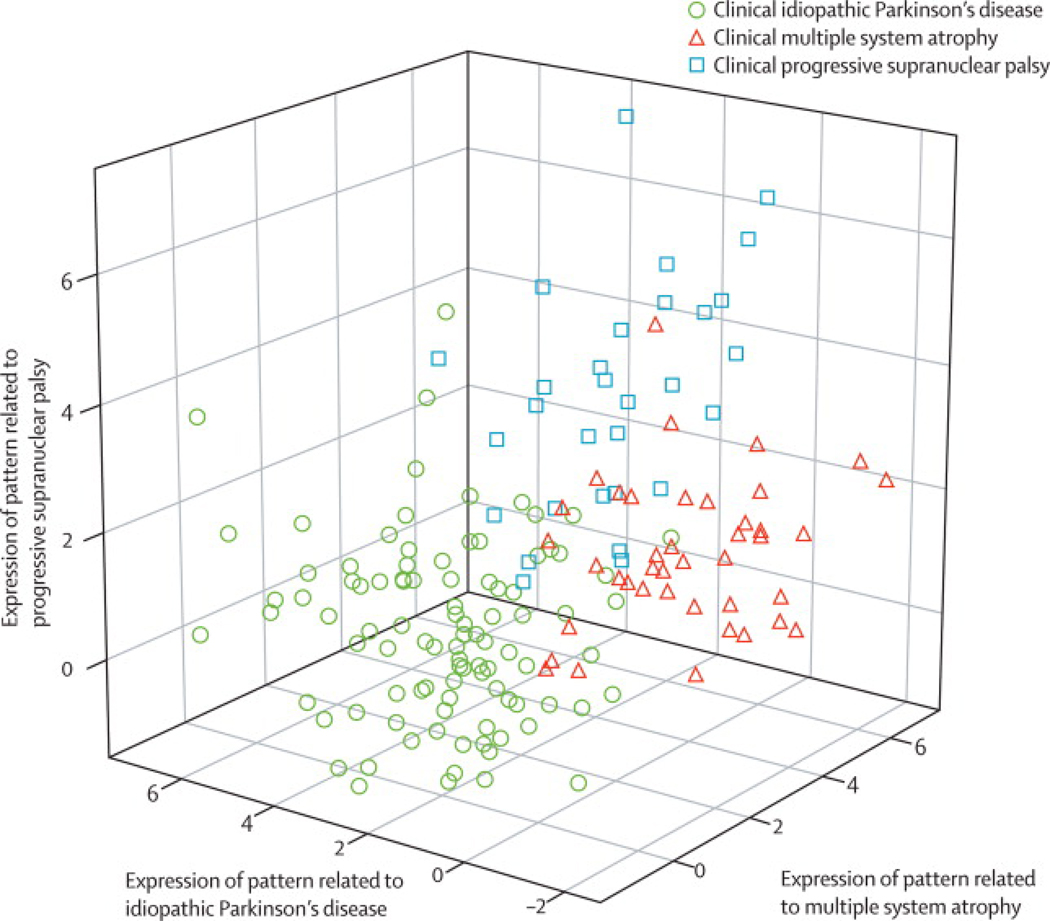
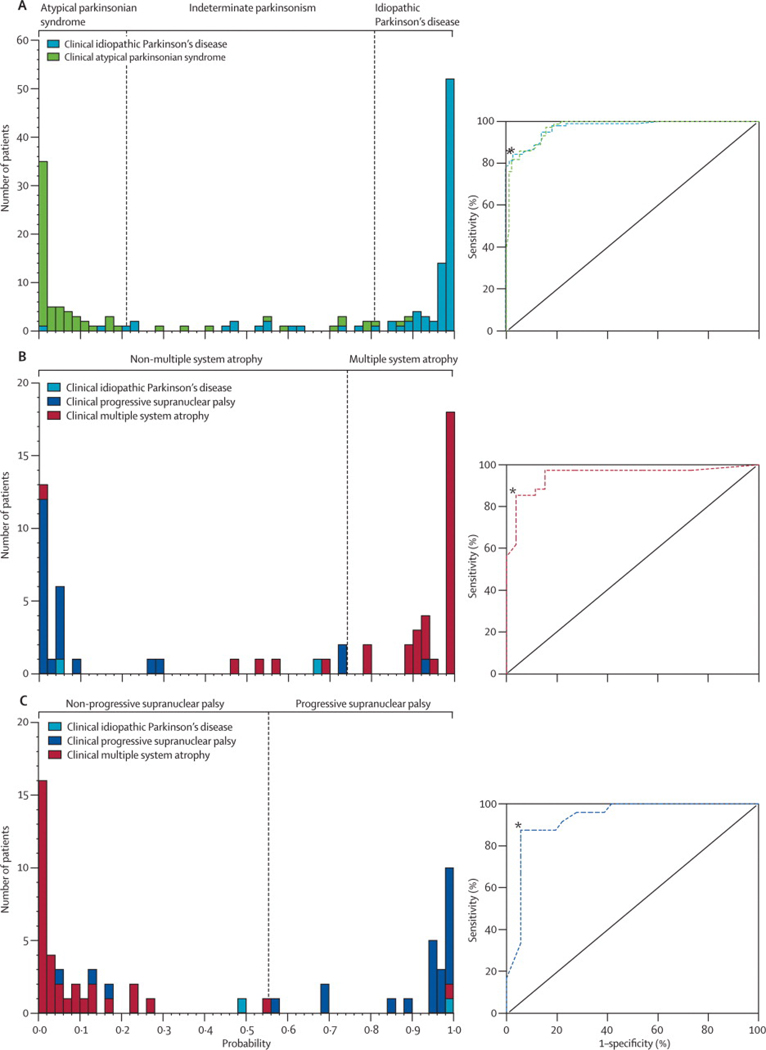
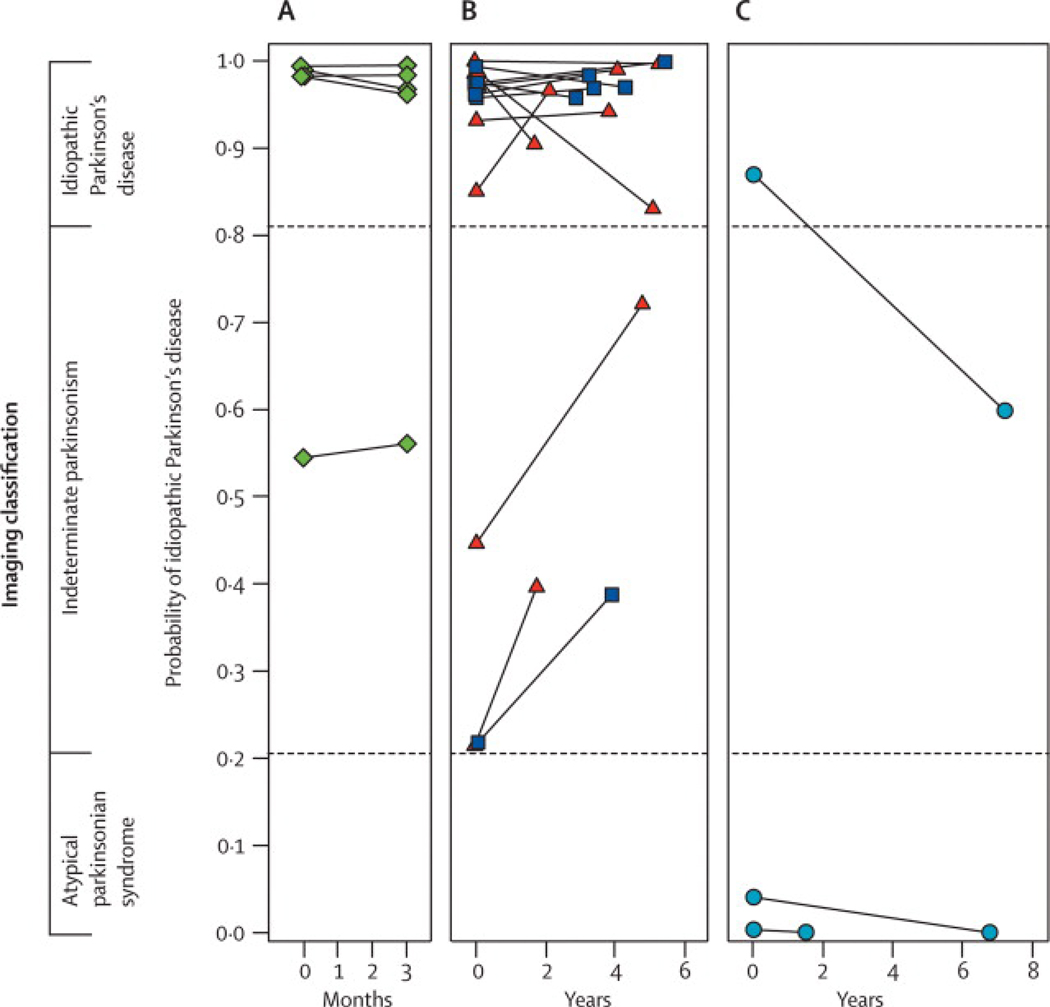
Recent developments: During recent years, spatial covariance analysis has been used with (18)F-fluorodeoxyglucose PET to detect abnormal patterns of brain metabolism in patients with neurodegenerative disorders. Rapid, automated, voxel-based algorithms have been used with metabolic imaging to quantify the activity of disease-specific networks. This approach has helped to characterise the unique metabolic patterns associated with the motor and cognitive features of Parkinson's disease. The results of several studies have shown correction of abnormal motor, but not cognitive, network activity by treatment with dopaminergic therapy and deep brain stimulation. The authors of a longitudinal imaging study of early-stage Parkinson's disease reported substantial differences in the development of these metabolic networks over a follow-up of 4 years. WHERE NEXT?: Developments in network imaging have provided the basis for several new applications of metabolic imaging in the study of Parkinson's disease. A washout study is currently underway to determine the long-duration effects of dopaminergic therapy on the network activity related to Parkinson's disease, which will be useful to plan future trials of disease-modifying drugs. Network approaches are also being applied to the study of atypical parkinsonian syndromes. The characterisation of specific patterns associated with atypical parkinsonian syndromes and classic Parkinson's disease will be the basis for a fully automated imaging-based procedure for early differential diagnosis. Efforts are underway to quantify the networks related to Parkinson's disease with less invasive imaging methods. Assessments of network activity with perfusion-weighted MRI show excellent concordance with measurements done with established radiotracer techniques. This approach will ultimately enable the assessment of abnormal network activity in people who are genetically at risk of Parkinson's disease.


Conflict of interest statement

Conflict of Interest

The authors have no conflicts of interest to disclose.

Figures

Figure 1
Figure 1
A. Parkinson’s disease-related pattern (PDRP) identified by network analysis of FDG PET scans from 33 PD patients and 33 age-matched normal volunteers. This spatial covariance pattern was characterized by relative increases in pallido-thalamic, pontine, and cerebellar metabolism, associated with decreases in the premotor and posterior parietal areas. [The display represents voxels that contribute significantly to the network at p = 0.001 and which are reliable (p < 0.001) on bootstrap estimation. Voxels with positive region weights (metabolic increases) are color coded from red to yellow; those with negative region weights (metabolic decreases) are color coded from blue to purple.] B. Region weights on PD-related spatial covariance patterns identified in seven independent populations of patients and healthy subjects undergoing metabolic imaging in the rest state (see text). The statistical criteria employed to select these patterns have been provided elsewhere. These metabolic networks were found to be similar across sites (r = 0.75, p < 0.001 for between-center correlations of PDRP region weights). The patterns were characterized by significant contributions from the putamen/globus pallidus, thalamus, and cerebellum (metabolic increases), and from the lateral premotor and parietal association regions (metabolic decreases). [Region weights of absolute value > 1 correspond to areas with significant local metabolic contributions to network activity (p < 0.001). The bold line indicates population-averaged regional loadings across centers.] C. PDRP expression in the 33 PD patients and 33 age-matched healthy control subjects whose FDG PET scans were originally used to identify the pattern (left panel), and in 32 subsequent age- and disease severity-matched PD patients whose scans were used to validate the pattern on a prospective case basis (right panel). Network activity was elevated in both PD patient cohorts relative to the healthy volunteer group (p < 0.001 for each patient cohort; Student’s t test). [Error bars indicate standard deviations] D. Mean PDRP activity in 15 early stage PD patients followed longitudinally at baseline, 24 and 48 months. Network activity increased over time (p < 0.0001; repeated measures analysis of variance). PDRP expression in the patient group was significantly elevated at all three timepoints relative to values for 15 age-matched healthy control subjects. [PDRP values were adjusted so that zero represents the mean for the healthy control group. The dashed line represents one standard deviation above the normal mean. Bars represent the standard error for the PD patient group at each timepoint. Asterisks represent the significance of comparisons with control values at each timepoint (*p < 0.05, **p < 0.001, ***p < 0.0001; post hoc Tukey tests)]
Figure 2
Figure 2
A. Parkinson’s disease-related cognitive pattern (PDCP) identified by network analysis of FDG PET scans from 15 non-demented PD patients with mild-moderate motor symptoms. This spatial covariance pattern was characterized by metabolic reductions in the dorsolateral prefrontal cortex, rostral supplementary motor area (preSMA), and medial-superior parietal regions, associated with increases in the cerebellum and dentate nucleus. B. Correlations between PDCP expression and performance on the California Verbal Learning Test (CVLT Sum) in the original identification group (n = 15; squares) and in the prospective validation group (n = 32; triangles). Significant linear relationships between network activity and performance were present for the whole sample (R2 = 0.36; p < 0.001; fitted regression line and 95% confidence intervals), as well as for the original and the prospective samples. Similar correlations were found between PDCP activity and tests of executive functioning in the same patient cohort. C. Mean PDCP activity for 18 PD patients with mild cognitive impairment (MCI+) and 18 cognitively intact PD patients (MCI−) (see text). The two groups were matched for age, motor disability, disease duration, and educational level. PDCP network activity was elevated in the MCI+ group relative to the MCI- group (**p < 0.01, Student’s t test). [Error bars indicate standard deviations. Figure courtesy of Dr. C. Huang]. D. Mean PDCP activity in 15 early stage PD patients followed longitudinally at baseline, 24 and 48 months. Network activity increased over time (p < 0.0001; repeated measures analysis of variance). PDCP expression in these patients was within the normal range at the first two timepoints, but reach abnormal levels relative to controls (p < 0.001) at the final timepoint. [PDCP values were adjusted so that zero represents the mean for the healthy control group. The dashed line represents one standard deviation above the normal mean. Bars represent the standard error for the PD patient group at each timepoint. Asterisks represent the significance of comparisons with control values at each timepoint (***p < 0.001; post hoc Tukey tests)]
Figure 3
Figure 3
Schematic showing significant correlations (p < 0.01) between changes in UPDRS motor ratings, PDRP network activity, and striatal DAT binding during the progression of early stage PD. The grey areas indicate overlap between pairs of measures, represented by the strength (R2) of their within-subject correlations. The black area indicates the commonality (interaction effect) of the three measures.
Figure 4
Figure 4
Reliability of imaging classification on repeat testing Probabilities of idiopathic Parkinson’s disease and atypical parkinsonian syndrome computed from the initial and repeat scans of 22 patients. Values from the two scans from each patient are connected by solid lines. Significant agreement (p<0·0001) was found between the image-based classifications from the two scans for these patients. Probability of atypical parkinsonian syndrome is the inverse of that for idiopathic Parkinson’s disease. (A) Five patients clinically diagnosed with idiopathic Parkinson’s disease who were drug-naive at the time of the initial scan and who were rescanned after 3 months of oral carbidopa plus levodopa treatment. (B) 14 patients with clinical idiopathic Parkinson’s disease who were scanned twice in the off-state. Six patients (blue squares) were drug-naive at baseline and eight (red triangles) were receiving chronic oral treatment at the time of the first scan. All were receiving levodopa treatment chronically at the time of repeat scanning. (C) Three patients clinically diagnosed with multiple system atrophy who had repeat scanning.
Figure 5
Figure 5
Disease-related metabolic patterns and post-mortem findings (A) The pattern related to idiopathic Parkinson’s disease (left)15 is characterised by increased (red areas) pallidothalamic and pontocerebellar metabolic activity associated with relative reductions (blue areas) in the premotor cortex, supplementary motor area, and parietal association regions. Neuropathological findings (right) from the substantia nigra pars compacta of a patient classified as having idiopathic Parkinson’s disease with a likelihood of 99% on the basis of fluorine-18-labelled-fluorodeoxyglucose (FDG)-PET 5·8 years before death. Diagnosis was confirmed at post-mortem examination, with the demonstration of Lewy-body containing neurons and severe cell loss in this region (LHE, 630X; top). Neuronal inclusions stained positively for α-synuclein (α-synuclein antibody, 400X; bottom). (B) The multiple system atrophy-related pattern (left)16 is characterised by bilateral metabolic reductions in putamen and cerebellar activity. Neuropathological findings (right) from a patient classified as having multiple system atrophy with a likelihood of 98% on the basis of FDG-PET 3 years before death. Autopsy revealed characteristic changes in abnormal hypometabolic pattern areas, with neuronal loss and gliosis in the putamen (top) and cerebellum (bottom). Both regions displayed glial cytoplasmic inclusions (Gallyas stain, 200X). Insets: putamen, 400X; cerebellum, 630X. (C) The progressive supranuclear palsy-related pattern (left)16 is characterised by metabolic reductions in the upper brainstem, medial frontal cortex, and medial thalamus. Neuropathological findings (right) from a patient classified as having progressive supranuclear palsy with a likelihood of 99% on the basis of FDG-PET 3�9 years before death. Post-mortem examination confirmed this diagnosis, with characteristic histopathological changes in abnormal hypometabolic pattern areas, in the pons (top) and frontal cortex (bottom). Argyrophilic globosum neuronal tangles were noted in the basis pontis (Bielschowsky stain 400X). A neuronal tangle with cytoplasmic inclusions and neuropil threads is displayed from the fifth cortical layer of the prefrontal region (AT8 stain, 630X). Tufted astrocytes (not shown) were present in this cortical region, the amygdala, globus pallidus, and claustrum. LHE=Luxol fast blue with haematoxylin and eosin.

References

    1. Alves G, Larsen JP, Emre M, Wentzel-Larsen T, Aarsland D. Changes in motor subtype and risk for incident dementia in Parkinson's disease. Mov Disord. 2006;21:1123–1130. - PubMed
    1. Langston JW. The Parkinson's complex: parkinsonism is just the tip of the iceberg. Ann Neurol. 2006;59:591–596. - PubMed
    1. Ravina B, Eidelberg D, Ahlskog JE, et al. The role of radiotracer imaging in Parkinson disease. Neurology. 2005;64:208–215. - PubMed
    1. Trošt M, Dhawan V, Feigin A, Eidelberg D. PET and SPECT. In: Beal MF, Lang A, Ludolph A, editors. Neurodegenerative diseases: neurobiology pathogenesis and therapeutics. Cambridge: Cambridge University Press; 2005. pp. 290–300.
    1. Eckert T, Eidelberg D. Neuroimaging and therapeutics in movement disorders. NeuroRx. 2005;2:361–371. - PMC - PubMed

Publication types