. 2007;35(19):6458-74.
doi: 10.1093/nar/gkm676. Epub 2007 Sep 20.

The mitochondrial transcription termination factor mTERF modulates replication pausing in human mitochondrial DNA

Affiliations

The mitochondrial transcription termination factor mTERF modulates replication pausing in human mitochondrial DNA

Anne K Hyvärinen et al. Nucleic Acids Res. 2007.

Abstract

The mammalian mitochondrial transcription termination factor mTERF binds with high affinity to a site within the tRNA(Leu(UUR)) gene and regulates the amount of read through transcription from the ribosomal DNA into the remaining genes of the major coding strand of mitochondrial DNA (mtDNA). Electrophoretic mobility shift assays (EMSA) and SELEX, using mitochondrial protein extracts from cells induced to overexpress mTERF, revealed novel, weaker mTERF-binding sites, clustered in several regions of mtDNA, notably in the major non-coding region (NCR). Such binding in vivo was supported by mtDNA immunoprecipitation. Two-dimensional neutral agarose gel electrophoresis (2DNAGE) and 5' end mapping by ligation-mediated PCR (LM-PCR) identified the region of the canonical mTERF-binding site as a replication pause site. The strength of pausing was modulated by the expression level of mTERF. mTERF overexpression also affected replication pausing in other regions of the genome in which mTERF binding was found. These results indicate a role for TERF in mtDNA replication, in addition to its role in transcription. We suggest that mTERF could provide a system for coordinating the passage of replication and transcription complexes, analogous with replication pause-region binding proteins in other systems, whose main role is to safeguard the integrity of the genome whilst facilitating its efficient expression.


Figures
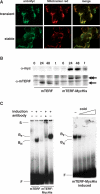
Figure 1.
Figure 1.
Overexpression of mTERF in cultured cells. (A) Immunocytochemistry of HEK293T cells transiently or stably transfected with mTERF-MycHis, using anti-Myc monoclonal antibody, counterstained with Mitotracker Red. (B) Western blots of mitochondrial protein extracts from Flp-In™ T-REx™-293 cells transfected with the mTERF or mTERF-MycHis constructs and induced for expression as indicated (0, 24, 48 h) or from transiently transfected (t) HEK293T cells, probed with anti-Myc or anti-mTERF antibodies, as indicated. The endogenous mTERF protein detected by the anti-mTERF antibody is singly arrowed. The mTERF-MycHis fusion protein detected by the same antibody is indicated by a double arrow. (C) EMSA using Leu-short dsDNA oligonucleotide probe and mitochondrial protein extracts from Flp-In™ T-REx™-293 cells transfected with the mTERF or mTERF-MycHis constructs and induced for expression as indicated. EMSA was carried out with or without anti-Myc antibody as shown (left-hand panel), or (right-hand panel) in the presence of an increasing amount of cold Leu-short dsDNA oligonucleotide competitor (1-, 10-, 100- and 1000-fold mass excess) or without competitor (−). The free probe (F), complexes formed by natural mTERF (BN) or the mTERF-MycHis fusion protein (BF), and the antibody-supershifted complex (S) are indicated. See also Supplementary Figure 1.
Figure 2.
Figure 2.
EMSA and mIP analysis of alternate mTERF-binding sites in human mtDNA. (A) Schematic diagram of regions of the mitochondrial genome in which binding was detected, showing NCR (white box), 16S and 12S rRNA genes (pale grey boxes), protein-coding genes ND1, ND2, COI and cyt b (darker grey boxes), tRNA genes (cross-hatched boxes), OH, OL and the promoters/transcriptional initiation sites of the two strands (PL, PH1 and PH2). Genes transcribed to the right shown above the centre line, genes transcribed to the left shown below. Nucleotide coordinates are as Ref. (82). Black bars indicate the positions of the 150 bp probe fragments which were found by EMSA to contain strong or moderate binding sites for mTERF, as shown in panels b and c. (B) Competition EMSA using the probes and competitors as shown, plus mitochondrial protein extract from cells induced to express mTERF-MycHis. The amounts of cold competitor represent 1-, 10- and 100-fold mass excess over the probe. Similar results were obtained using extracts from cells overexpressing natural mTERF (data not shown). (C) EMSA analyses of binding to 150 bp probe fragments as indicated, using mitochondrial protein extracts from Flp-In™ T-REx™-293 cells transfected either with natural mTERF or with mTERF-MycHis (mTERF-mh) and induced for expression (or not) as indicated. Supershifting with the anti-Myc monoclonal antibody was performed for the lanes indicated. Supershifted complexes are denoted by arrows. Although the supershifted complex is minor in some cases, the main complex is always efficiently removed by the antibody, confirming the presence of mTERF-MycHis. Other antibodies tested (e.g. anti-FLAG) gave no supershifting and did not inhibit the formation of these complexes. For further experiments confirming specificity of binding and negative/weak findings using other fragments, see Supplementary Figures 1 and 2. (D) mIP analysis of mTERF-MycHis binding in vivo. Immunoprecipitation used anti-Myc (M), anti-FLAG (F) or no antibody (−). Amplification of immunoprecipitates alongside corresponding input DNAs used the same primer pairs as were employed to generate the corresponding fragments for EMSA (see Supplementary Table 1), Samples were from Flp-In™ T-REx™-293 cells induced for mTERF-MycHis expression, except for fragment Leu, where extracts from uninduced cells were also tested. (E) Summary of EMSA results combining the data from this figure, Supplementary Figure 2, and other (negative) data not shown. The regions of the genome which were probed are reproduced from part (a) of the two figures, plus the ND5-ND6 gene junction which was probed using a dsDNA oligonucleotide. Binding is denoted as strong (filled circles), moderate (grey circles), weak (open circles), questionable (dotted circle, fragment OH5, as discussed in the text and legend to Supplementary Figure 2) or absent (no circles). Our inference of binding is based on the fact that EMSA signals were enhanced by induction of expression of both mTERF and mTERF-MycHis, that the complexes migrated at slightly different positions consistent with the presence of the epitope tag in the latter case, and that the complexes formed by mTERF-MycHis were supershifted by the anti-Myc antibody. The assertion that binding is strong, moderate or weak is based either on actual competition experiments (OH1 and ND1.1), or simply on the strength of the EMSA signal. Where the above criteria were not fulfilled, binding was scored as negative. In summary, the ND1 coding region and following IQM tRNA cluster contain at least four weak binding sites for mTERF. The NCR contains three weak binding sites, as well as three additional sites which showed very weak or questionable mTERF binding, as shown. A weak binding site was also found in the vicinity of OL.
Figure 3.
Figure 3.
2DNAGE analysis of replication pausing in human mtDNA (region spanning from 16S rDNA through OL). (A) Schematic map of human mtDNA showing relevant restriction sites, OH, OL, the approximate locations of the probe used (ND2, see Supplementary Table 1), denoted by an asterisk, the NCR (bold, dark grey) and rDNA (bold, pale grey). (B) 2DNAGE analysis of ND2-containing (3.6 kb) PvuII–AccI fragment from four human cell-lines as indicated, with and without treatment, after digestion, with S1 nuclease. Prominent pause sites ‘a’–‘d’, arrowed, schematized in part (d). A prominent intermediate, lying below the Y-arc between ‘c’ and ‘d’, is a product of S1 nuclease digestion, and probably represents a paused species containing a single-stranded gap. (C) 2DNAGE analysis of the 3.6 kb PvuII–AccI fragment from four human autopsy tissues as indicated, treated with S1 nuclease after digestion. Prominent pause sites ‘a’–‘d’, arrowed, schematized in part (D). (E) Map of the 3.6 kb PvuII–AccI fragment showing the approximate locations of the pause sites and mTERF-binding sites, with the gene locations in the region (16S rRNA in light grey, ND1, ND2 and COI protein-coding genes in dark grey, tRNAs cross-hatched, non-coding DNA at OL in white) shown below. Limits of the mTERF-binding sites are based on the EMSA data of Figure 2 and Supplementary Figure 2. Approximate locations of pause sites extrapolated from first-dimension migration, calibrated by positions of 1n, 2n, linear partials and apex of Y-arc. Depending on compression artefacts, actual pause sites may be located up to 150 bp further from the ends of the segments as shown. Pause ‘c’ (open box), when present, appears to extend over a wider segment than the other pauses.
Figure 4.
Figure 4.
2DNAGE analysis of mtDNA replication pausing in mTERF-overexpressing cells. (A) Schematic map of human mtDNA using same nomenclature as Figure 3a, showing relevant restriction sites and approximate locations of probes. (B–D) 2DNAGE analysis of mtDNA from cells induced to overexpress mTERF, compared with uninduced cells. To facilitate visualization of pause sites, samples were treated with S1 nuclease following restriction digestion, where indicated. Pause sites ‘a’–‘d’ arrowed, plus other species as discussed in text. The exposures of the uninduced and induced panels i and ii of (b) were adjusted for comparability, based on loading, after measuring phosphorimager signals from the unit-length fragment. Pause site ‘h’, as visualized in part (c), appears to be unrelated to mTERF expression. In part (d), the paused bubble, ‘m’ (PvuII digest), and the highly asymmetric double-Y species ‘j’ (NheI digest), both enhanced relative to other species by mTERF overexpression, are predicted products of pausing in the ND1/tRNALeu(UUR) region. Subtle modifications are also seen in the region of the gel in which X, double-Y and broken theta molecules migrate, notably a decrease in the abundance of putative termination intermediates ‘t’ (see also Supplementary Figure 4). ‘o’—uncut circles and gapped circles.
Figure 5.
Figure 5.
Downregulation of mTERF expression by RNA interference. (A) Western blot assay of mTERF knockdown by siRNA mTERF.1 (directed against mTERF mRNA) and siRNA Control. HEK293T cells were either untransfected (−), transiently transfected (t) or stably (+) transfected with an mTERF-MycHis expression construct. Cells were then assayed 24, 48 and 72 h following siRNA transfection or else without such transfection (−). The arrowed band is the mTERF-MycHis fusion protein, migrating between two background bands which appear in all westerns and thus provide an internal loading control. Note that the sample from untransfected, non-siRNA-treated cells in the upper panel (penultimate lane) is approximately 3-fold overloaded. (B) Immunocytochemistry of HEK293T cells stably transfected with mTERF-MycHis expression construct and then either mock transfected or transiently transfected with siRNA mTERF.1. Immunocytochemistry used the anti-Myc monoclonal antibody, and counterstaining with Mitotracker Red. (C) EMSA using Leu-short dsDNA oligonucleotide probe and mitochondrial protein extracts from HEK293T cells with or without stable transfection of mTERF-MycHis expression construct, followed by transient transfection for 48 h with or without siRNA mTERF.1. Despite the apparent difference in signal, the experimental conditions are the same as in Figure 1c: only the exposure time is different, and the amount of background signal in the gel. (D) 2DNAGE of mtDNA from untreated HEK293T cells or cells transfected with siRNA mTERF.1 for 48 h. PvuII + AccI digest (S1 treated) probed for the 3.6 kb fragment using ND2 probe. Panels iii and iv are longer exposures of panels i and ii, respectively. Note the down-regulation of the X-spike (‘x’) and pause site ‘a’, as well as of pause site ‘b’ relative to pause region ‘c’ (see Figure 3). (E) Phosphorimager-calibrated exposures of 2DNAGE blots from siRNA-treated cells (panel iii) alongside the corresponding images (panels i and ii) from uninduced and induced mTERF over-expressing cells, reproduced from Figure 4b. A longer exposure (panel iv) confirms the absence of pause ‘a’.
Figure 6.
Figure 6.
LM-PCR analysis of DNA 5′ ends. (AD) Analysis of L-strand 5′ ends in the ND1-ND2 region, using primer sets TL1/TL2/TL7, TL8/TL9/L11 and TL8/TL9/TL11, respectively, shown alongside sequencing ladders for the corresponding segments. Samples analysed represent a time-course of induction of mTERF overexpression from 0–72 h (d). Analysis of H-strand 5′ ends in the OH region using primer set H1/H2/H5. (E) and (F) Schematic summary diagrams of the LM-PCR findings in the 16S rRNA-OL and OH regions, respectively. Shown below the scale lines are the positions (vertical lines) of the major 5′ ends detected, with those exhibiting clearly increased abundance in mTERF-overexpressing cells also indicated by filled circles. Gene locations shown below (12S and 16S rRNA in light grey, cyt b, ND1, ND2 and COI protein-coding genes in dark grey, tRNAs cross-hatched, non-coding DNA in NCR and at OL in white). LM-PCR data are compiled from parts (a–d) of this figure, plus parts (b–i) of Supplementary Figure 5. Above the scale lines are indicated the positions of mTERF-binding sites and replication pauses inferred from other experiments: in (e) reproduced from Figure 3d, and in (f) compiled from data of Figures 2 and 4, plus Supplementary Figure 2. Based on the data of Figure 4, the OH pause region enhanced by mTERF overexpression extends across most of the NCR. The white box in (f) indicates the assumed position of the pause site giving rise to species ‘n’ in Figure 4c, i.e. assuming initiation close to OH. The open circle denotes the minor lagging strand 5′ end mapping in this region (np 16197), which was enhanced by mTERF overexpression. The positions of the various mTERF-binding sites in the NCR were inferred from EMSA using overlapping 150 bp fragments, as shown.

References

    1. Asin-Cayuela J, Gustafsson CM. Mitochondrial transcription and its regulation in mammalian cells. Trends Biochem. Sci. 2007;32:111–117. - PubMed
    1. Fernandez-Silva P, Enriquez JA, Montoya J. Replication and transcription of mammalian mitochondrial DNA. Exp. Physiol. 2003;88:41–56. - PubMed
    1. Christianson TW, Clayton DA. A tridecamer sequence supports human mitochondrial RNA 3′ end formation. Mol. Cell. Biol. 1988;8:4502–4509. - PMC - PubMed
    1. Kruse B, Narasimhan N, Attardi G. Termination of transcription in human mitochondria: identification and purification of a DNA-binding protein factor that promotes termination. Cell. 1989;58:391–397. - PubMed
    1. Daga A, Micol V, Hess D, Aebersold R, Attardi G. Molecular characterization of the transcription termination factor from human mitochondria. J. Biol. Chem. 1993;268:8123–8130. - PubMed

Publication types

MeSH terms