. 2007 Nov 15;585(Pt 1):57-74.
doi: 10.1113/jphysiol.2007.142935. Epub 2007 Sep 20.

Chromophore switch from 11-cis-dehydroretinal (A2) to 11-cis-retinal (A1) decreases dark noise in salamander red rods

Affiliations

Chromophore switch from 11-cis-dehydroretinal (A2) to 11-cis-retinal (A1) decreases dark noise in salamander red rods

Petri Ala-Laurila et al. J Physiol. .

Abstract

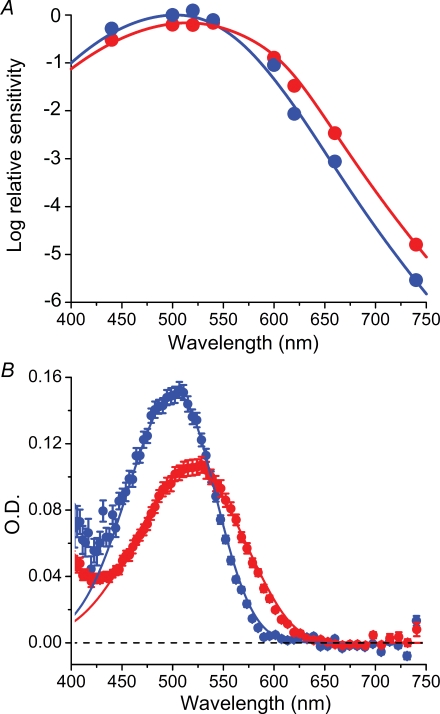
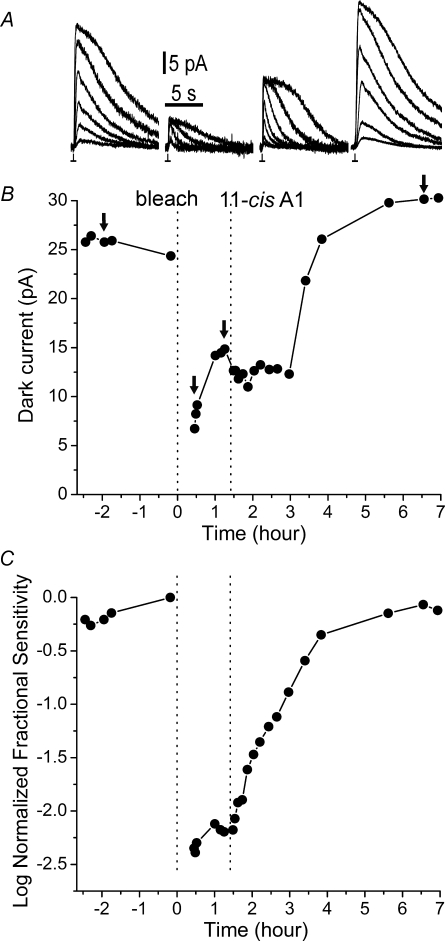
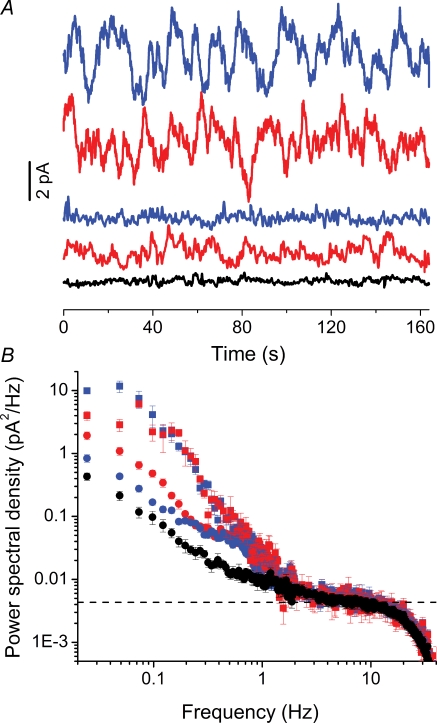
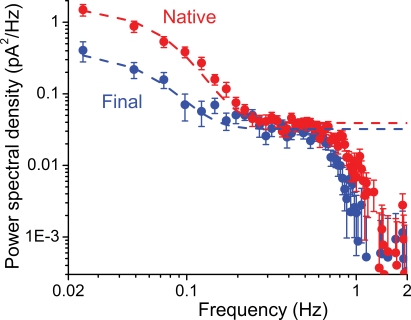
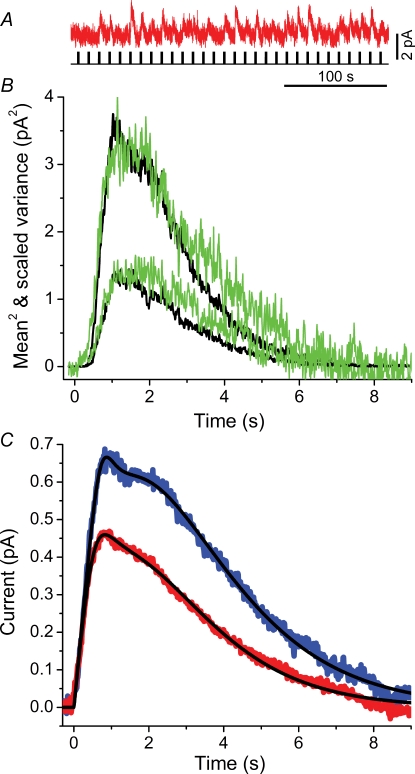
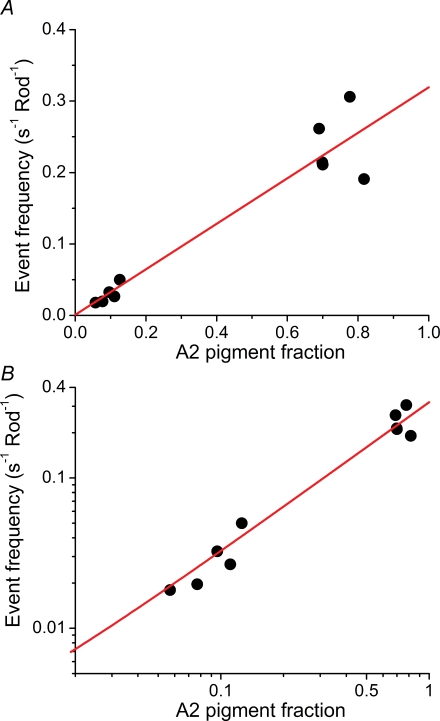
Dark noise, light-induced noise and responses to brief flashes of light were recorded in the membrane current of isolated rods from larval tiger salamander retina before and after bleaching most of the native visual pigment, which mainly has the 11-cis-3,4-dehydroretinal (A2) chromophore, and regenerating with the 11-cis-retinal (A1) chromophore in the same isolated rods. The purpose was to test the hypothesis that blue-shifting the pigment by switching from A2 to A1 will decrease the rate of spontaneous thermal activations and thus intrinsic light-like noise in the rod. Complete recordings were obtained in five cells (21 degrees C). Based on the wavelength of maximum absorbance, lambda max,A1 = 502 nm and lambda max,A2 = 528 nm, the average A2 : A1 ratio determined from rod spectral sensitivities and absorbances was approximately 0.74 : 0.26 in the native state and approximately 0.09 : 0.91 in the final state. In the native (A2) state, the single-quantum response (SQR) had an amplitude of 0.41 +/- 0.03 pA and an integration time of 3.16 +/- 0.15 s (mean +/- s.e.m.). The low-frequency branch of the dark noise power spectrum was consistent with discrete SQR-like events occurring at a rate of 0.238 +/- 0.026 rod(-1) s(-1). The corresponding values in the final state were 0.57 +/- 0.07 pA (SQR amplitude), 3.47 +/- 0.26 s (SQR integration time), and 0.030 +/- 0.006 rod(-1) s(-1) (rate of dark events). Thus the rate of dark events per rod and the fraction of A2 pigment both changed by ca 8-fold between the native and final states, indicating that the dark events originated mainly in A2 molecules even in the final state. By extrapolating the linear relation between event rates and A2 fraction to 0% A2 (100% A1) and 100% A2 (0% A1), we estimated that the A1 pigment is at least 36 times more stable than the A2 pigment. The noise component attributed to discrete dark events accounted for 73% of the total dark current variance in the native (A2) state and 46% in the final state. The power spectrum of the remaining 'continuous' noise component did not differ between the two states. The smaller and faster SQR in the native (A2) state is consistent with the idea that the rod behaves as if light-adapted by dark events that occur at a rate of nearly one per integration time. Both the decreased level of dark noise and the increased SQR amplitude must significantly improve the reliability of photon detection in dim light in the presence of the A1 chromophore compared to the native (A2) state in salamander rods.


Figures

Figure 1
Figure 1
Determination of pigment content in rods before and after bleaching and regeneration with A1 A, log values of relative spectral sensitivities determined electrophysiologically in one rod (cell 3 in Table 1). Red, native state; blue, final state after ca 90% bleach and regeneration with A1. The curves fitted to the data are sums of Govardovskii et al. (2000) templates for A1 (λmax = 502 nm) and A2 pigments (λmax = 528 nm). In the native state, a fair fit (red curve) is obtained for a sum of templates corresponding to molecular proportions 30.0% A1 and 70.0% A2; in the final state (blue curve) the proportions are 90.4% A1 and 9.6% A2. The peak value of the ‘final’ spectrum has been normalized to unity and all sensitivities are expressed relative to this. The crossing point of curves lies at ca 546 nm and the ratio of the peak values (final/native) is 1.46. B, absorbance spectra recorded by MSP. The ordinate gives optical densities (O.D.) at each wavelength. Red: native state, mean ± s.e.m. of 10 rods from the same retina as the cell in A. Blue: final state, means ± s.e.m. of a sample of 14 cells from a different retina after a complete pigment bleach and regeneration with A1. The red curve is a sum of Govardovskii et al. (2000) templates for A1 and A2 corresponding to molecular proportions 19% A1 and 81% A2. The blue curve is a pure A1 (λmax = 502 nm) template. The crossing point lies at ca 539 nm and the ratio of the peak O.D. values (A1/native) is 1.43. Error bars show s.e.m.
Figure 2
Figure 2
The time course of changes in the light-sensitive current and fractional sensitivity of one rod throughout a complete experiment The vertical dashed lines mark the time points of: (1) the bleaching exposure (t = 0 min, middle point of 30 s light exposure); (2) introduction of ca 40 μm 11-cis-retinal (t = 89 min). Bath perfusion was halted for 20 min after the addition of 11-cis-retinal to incubate cells in the Ringer solution containing 11-cis-retinal. A, response families recorded at the times indicated by arrows in B. Flashes were 540 nm, 20 ms square-wave pulses. Each trace is the average of 1–30 responses to the same nominal flash intensity; intensities (photons μm−2 flash−1) increased in 0.5 log unit steps starting at the following values (response families from left to right, n = number of flashes averaged): 0.242 (n = 5); 271 (n = 1; the intensity step from the first to the second response was 1 log unit in this case to avoid crowding); 23.0 (n = 5); 0.242 (n = 20). The light-sensitive current and fractional sensitivity values plotted in B and C were determined by fitting Michaelis functions to flash intensity–response amplitude data of this type recorded throughout the experiment (see Methods). B, time course of changes in the light-sensitive current. C, time course of changes in log fractional sensitivity. Fractional sensitivity values have been normalized relative to the peak value. (Cell 1 in Table 1.)
Figure 4
Figure 4
Noise recordings and power spectra A, representative noise recordings. The two top traces show noise under a dim steady background light (2.4 Rh* s−1) in the final (blue) and native (red) state; the two middle traces show dark noise in the final (blue) and native (red) state; the bottom trace shows instrumental noise (black). All traces have been low pass filtered at 1 Hz. Same cell as in Fig. 3. B, total noise power spectra based on many recording sequences similar to those shown in A. Spectra from top to bottom (according to the zero-frequency asymptote): blue squares, noise under the dim background in the final state; red squares, noise under the dim background in the native state; red circles, dark noise in the native state; blue circles, dark noise in the final state; black circles, instrumental noise. Power spectra were smoothed at higher frequencies by averaging over 5 neighbouring points in the frequency range 2–10 Hz and over 10 points in the frequency range 10–40 Hz. The dashed line shows the Johnson noise level (0.0043 pA2 Hz−1) calculated from the resistance with the cell in the pipette (3.8 MΩ).
Figure 5
Figure 5
Difference spectra: dark noise – instrumental noise Dark noise difference spectra calculated from Fig. 4. The instrumental noise has been subtracted from the total dark noise: red circles, native state; blue circles, final state. The low-frequency noise component has been fitted with the sum of the power spectrum of the continuous noise plateau level (averaged over 0.3–0.5 Hz) and the scaled power spectrum of the respective SQR, calculated from the responses shown in Fig. 3C (see Methods). These fitted curves are shown by dashed lines: red, native state; blue, final state. The difference in this component representing discrete noise indicates a ca 10-fold difference in dark event rate between the native and final states. (Note that the corresponding noise power in the final state is relatively increased by the larger SQR.) The continuous noise component has been fitted with a straight line in the plateau region. There is no significant difference in this component between the native and the final state.
Figure 3
Figure 3
The single-photon response A, response variation exemplified in a sequence of 30 responses to the same nominal flash intensity (2.0 Rh* flash−1; Ac = 19 μm2) in the native state. Cell 4 in Table 1. B, square of the mean response (black) and scaled time-dependent ensemble variance (green) of dim flash responses at two different nominal light intensities (2.0 Rh* flash−1; Ac = 19 μm2) and (4.1 Rh* flash−1; Ac = 19 μm2) in the native state, same cell as in A. At both light intensities the results are based on three separate sequences of 30 responses each. The scaling factor of variance provides an estimate of the mean number of photoisomerizations produced by the flash: 4.0 Rh* at the higher intensity (cf. nominal value 4.1) and 2.6 Rh* at the lower intensity (cf. nominal value 2.0). The estimates for single-quantum amplitude are obtained simply by dividing the mean response by the scaling factor of the variance. The estimates for single quantum response (SQR) amplitude derived from the two examples in the figure are 0.50 pA (based on the responses to the brighter flash light intensity) and 0.47 pA (based on the responses to the lower flash intensity). C, the mean SQR in the native state (red) and the final state (blue); same cell as in A and B. The responses are averages of 7 SQR estimates obtained at different times of the experiment from the same cell. Each of these seven individual SQR estimates used for the calculation of the mean SQR were obtained by comparison of the squared mean response and the variance of a sequence of responses to 30–50 dim flashes such as shown in A. By estimating the SQR size at different times throughout the experiment, we could also check whether any systematic changes in the SQR amplitude occurred during the experiment. The black curves are model fits according to eqn (4).
Figure 7
Figure 7
Dark event rates per molecule of visual pigment in 11 species of rods Molecular dark event rates are plotted against the reciprocal of the wavelength of peak absorbance (1/λmax). The Briggsian logarithm of the rate constant (k) is plotted as a function of 1/λmax. The molecular rate constants have been corrected for differences in cell dimensions and temperature (all have been recalculated to 21°C; see details in Ala-Laurila et al. 2004a). The black symbols have been re-plotted from Ala-Laurila et al. (2004a). Red circles, native-state and final-state estimates for salamander rods from the present work; blue diamonds, present estimates for pure A1 and pure A2 pigment of salamander. The open squares show estimates for rods from the A2-dominated (dorsal) and A1-dominated (ventral) fields of bullfrog retina (Donner et al. 1990). Error bars are s.e.m. The black continuous line shows the original fit of the multimodal model of Ala-Laurila et al. (2004a) to the black data points.
Figure 6
Figure 6
Dark event rates per rod as a function of the fraction of A2 pigment A, the estimates of dark event rates of all 5 rods in Table 1 in the native and final states plotted against the fraction of A2 pigment. The red line shows the linear regression of event rate (y) on A2 content (x): y = 0.0009 + 0.318x. All event rates have here been normalized to the mean outer segment (OS) volume recorded in our experiments (2100 μm3), thus correcting for volume differences in the individual recordings. B, the same data as in A shown on logarithmic scales.

References

    1. Aho AC, Donner K, Helenius S, Olesen Larsen L, Reuter T. Visual performance of the toad (Bufo bufo) at low light levels: retinal ganglion cell responses and prey-catching accuracy. J Comp Physiol [A] 1993;172:671–682. - PubMed
    1. Aho AC, Donner K, Hyden C, Larsen LO, Reuter T. Low retinal noise in animals with low body temperature allows high visual sensitivity. Nature. 1988;334:348–350. - PubMed
    1. Ala-Laurila P, Donner K, Koskelainen A. Thermal activation and photoactivation of visual pigments. Biophys J. 2004a;86:3653–3662. - PMC - PubMed
    1. Ala-Laurila P, Pahlberg J, Koskelainen A, Donner K. On the relation between the photoactivation energy and the absorbance spectrum of visual pigments. Vision Res. 2004b;44:2153–2158. - PubMed
    1. Barlow HB. Retinal noise and absolute threshold. J Opt Soc Am. 1956;46:634–639. - PubMed

Publication types

LinkOut - more resources