

A quantitative trait locus for variation in dopamine metabolism mapped in a primate model using reference sequences from related species
- PMID: 17884980
- PMCID: PMC1987389
- DOI: 10.1073/pnas.0707640104
A quantitative trait locus for variation in dopamine metabolism mapped in a primate model using reference sequences from related species
Abstract
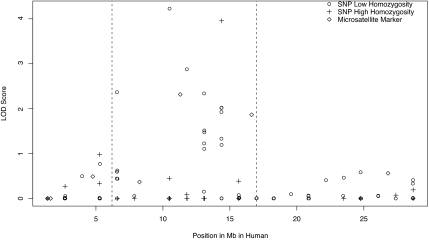
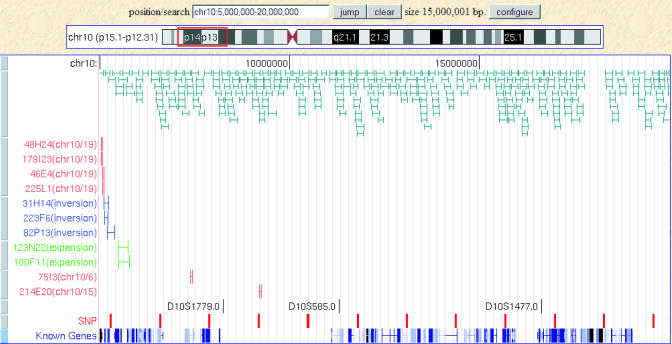
Non-human primates (NHP) provide crucial research models. Their strong similarities to humans make them particularly valuable for understanding complex behavioral traits and brain structure and function. We report here the genetic mapping of an NHP nervous system biologic trait, the cerebrospinal fluid (CSF) concentration of the dopamine metabolite homovanillic acid (HVA), in an extended inbred vervet monkey (Chlorocebus aethiops sabaeus) pedigree. CSF HVA is an index of CNS dopamine activity, which is hypothesized to contribute substantially to behavioral variations in NHP and humans. For quantitative trait locus (QTL) mapping, we carried out a two-stage procedure. We first scanned the genome using a first-generation genetic map of short tandem repeat markers. Subsequently, using >100 SNPs within the most promising region identified by the genome scan, we mapped a QTL for CSF HVA at a genome-wide level of significance (peak logarithm of odds score >4) to a narrow well delineated interval (<10 Mb). The SNP discovery exploited conserved segments between human and rhesus macaque reference genome sequences. Our findings demonstrate the potential of using existing primate reference genome sequences for designing high-resolution genetic analyses applicable across a wide range of NHP species, including the many for which full genome sequences are not yet available. Leveraging genomic information from sequenced to nonsequenced species should enable the utilization of the full range of NHP diversity in behavior and disease susceptibility to determine the genetic basis of specific biological and behavioral traits.
Conflict of interest statement
The authors declare no conflict of interest.
Figures
References
-
- Kendler KS, Baker JH. Psychol Med. 2006;19:1–12.
-
- Suomi SJ, Higley JD. NIDA Res Monogr. 1991;114:291–302. - PubMed
-
- Rogers J, Mahaney MC, Witte SM, Nair S, Newman D, Wedel S, Rodriguez LA, Rice KS, Slifer SH, Perelygin A, et al. Genomics. 2000;67:237–247. - PubMed
-
- Rogers J, Garcia R, Shelledy W, Kaplan J, Arya A, Johnson Z, Bergstrom M, Novakowski L, Nair P, Vinson A, et al. Genomics. 2006;87:30–38. - PubMed
-
- Cox LA, Mahaney MC, Vandeberg JL, Rogers J. Genomics. 2006;88:274–281. - PubMed
Publication types
MeSH terms
Substances
Grants and funding
LinkOut - more resources
Full Text Sources
Other Literature Sources
Miscellaneous
