

Reduced expression of succinyl-coenzyme A ligase can be compensated for by up-regulation of the gamma-aminobutyrate shunt in illuminated tomato leaves
- PMID: 17885090
- PMCID: PMC2048777
- DOI: 10.1104/pp.107.103101
Reduced expression of succinyl-coenzyme A ligase can be compensated for by up-regulation of the gamma-aminobutyrate shunt in illuminated tomato leaves
Abstract
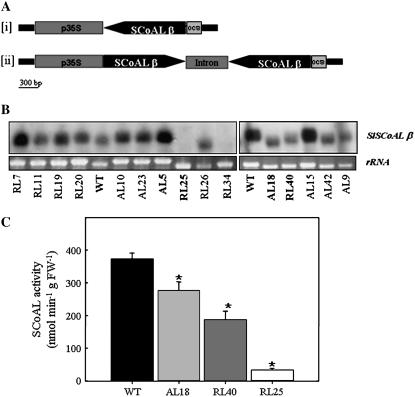
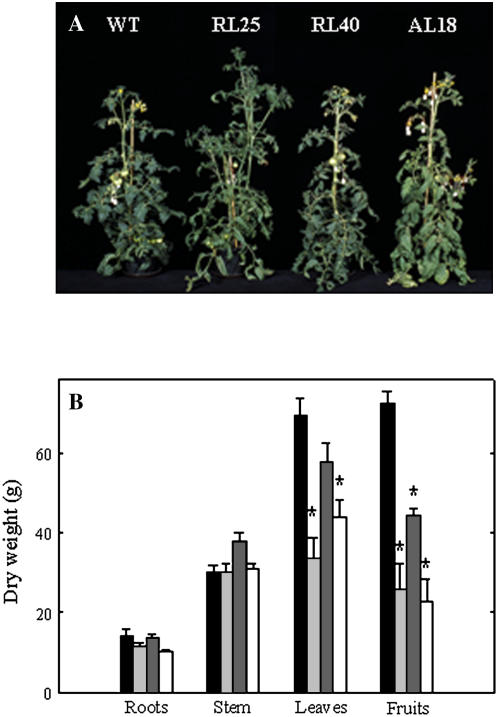
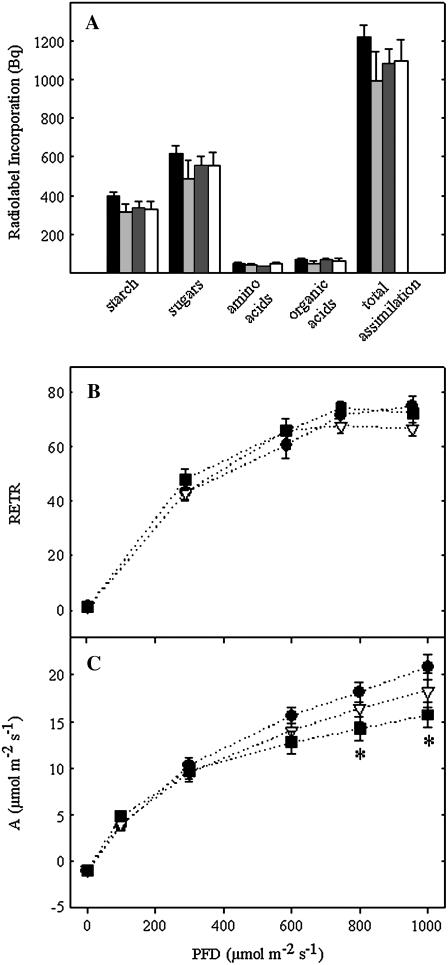
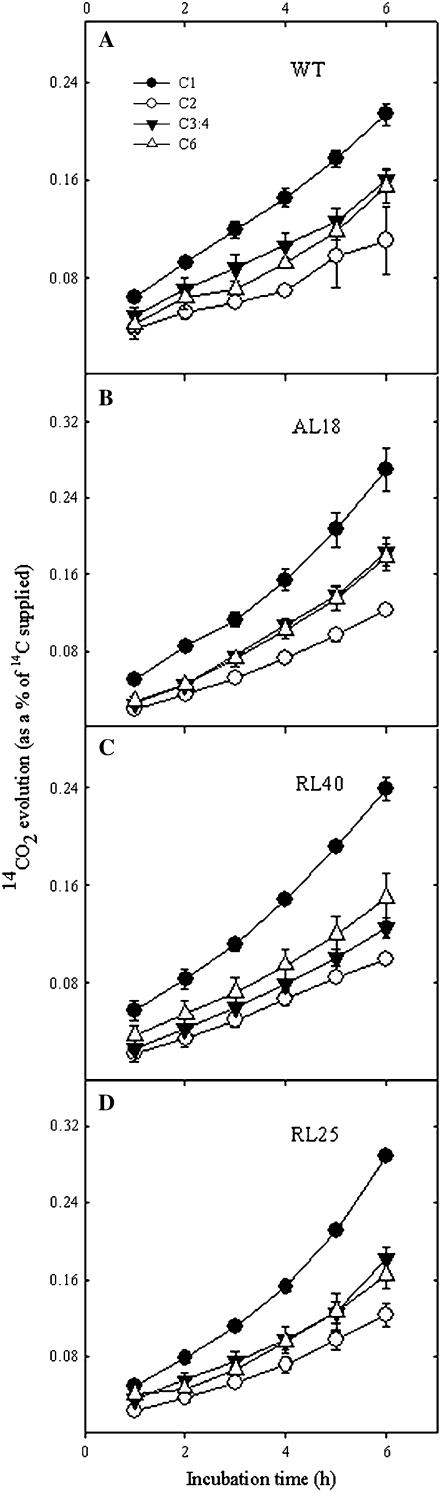
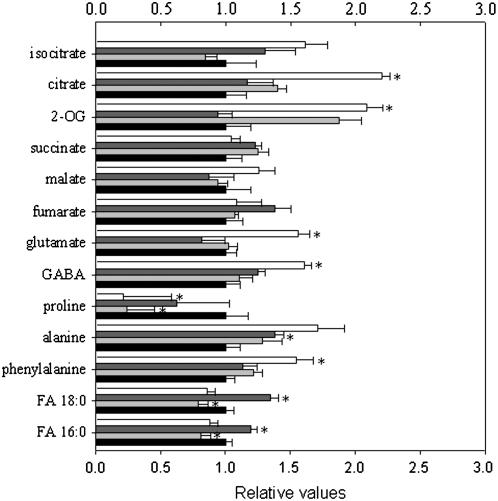
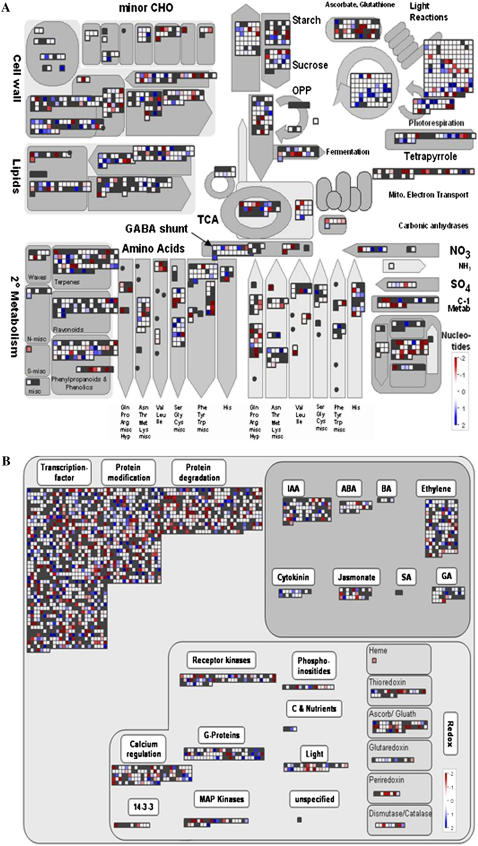
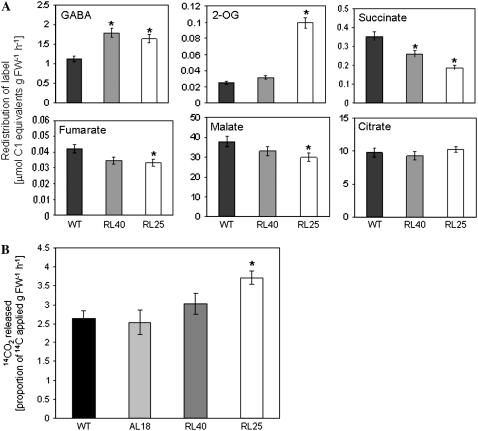
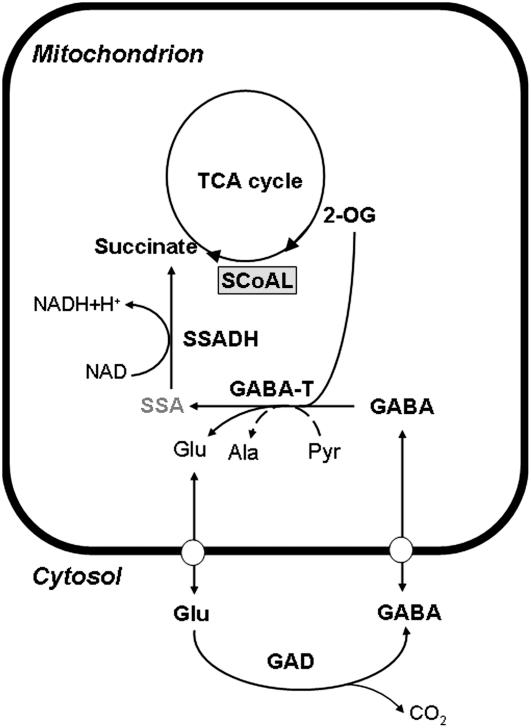
Increasing experimental evidence suggests that the tricarboxylic acid cycle in plants is of greater importance in illuminated photosynthetic tissues than previously thought. In this study, transgenic tomato (Solanum lycopersicum) plants expressing a fragment of the beta-subunit of succinyl-coenzyme A ligase in either the antisense orientation or using the RNA interference approach, however, revealed little alteration in either photosynthesis or plant growth despite exhibiting dramatic reductions in activity. Moreover, the rate of respiration was only moderately affected in the transformants, suggesting that this enzyme does not catalyze a crucial step in mitochondrial respiration. However, metabolite and transcript profiling of these lines alongside enzyme and label redistribution experiments revealed that, whereas considerable activity of this enzyme appears to be dispensable, the reason for such a mild phenotype in extremely inhibited lines was an up-regulation of an alternative pathway for succinate production-that offered by the gamma-aminobutyric acid shunt. When taken together, these data highlight the importance both of succinate production for mitochondrial metabolism and the interplay between various routes of its production. The results are discussed in the context of current models of plant respiration in mitochondrial and cellular metabolism of the illuminated leaf.
Figures
Similar articles
-
Antisense inhibition of the 2-oxoglutarate dehydrogenase complex in tomato demonstrates its importance for plant respiration and during leaf senescence and fruit maturation.Plant Cell. 2012 Jun;24(6):2328-51. doi: 10.1105/tpc.112.099002. Epub 2012 Jun 29. Plant Cell. 2012. PMID: 22751214 Free PMC article.
-
Mild reductions in mitochondrial citrate synthase activity result in a compromised nitrate assimilation and reduced leaf pigmentation but have no effect on photosynthetic performance or growth.Plant Physiol. 2008 May;147(1):115-27. doi: 10.1104/pp.108.117978. Epub 2008 Mar 21. Plant Physiol. 2008. PMID: 18359839 Free PMC article.
-
Suppression of γ-aminobutyric acid (GABA) transaminases induces prominent GABA accumulation, dwarfism and infertility in the tomato (Solanum lycopersicum L.).Plant Cell Physiol. 2013 May;54(5):793-807. doi: 10.1093/pcp/pct035. Epub 2013 Feb 23. Plant Cell Physiol. 2013. PMID: 23435575
-
Deficiency of mitochondrial fumarase activity in tomato plants impairs photosynthesis via an effect on stomatal function.Plant J. 2007 Jun;50(6):1093-106. doi: 10.1111/j.1365-313X.2007.03115.x. Epub 2007 Apr 25. Plant J. 2007. PMID: 17461782
-
Metabolic control and regulation of the tricarboxylic acid cycle in photosynthetic and heterotrophic plant tissues.Plant Cell Environ. 2012 Jan;35(1):1-21. doi: 10.1111/j.1365-3040.2011.02332.x. Epub 2011 Jun 20. Plant Cell Environ. 2012. PMID: 21477125 Review.
Cited by
-
Comparative Analysis of VOCs from Winter Melon Pomace Fibers before and after Bleaching Treatment with H2O2.Molecules. 2022 Apr 5;27(7):2336. doi: 10.3390/molecules27072336. Molecules. 2022. PMID: 35408736 Free PMC article.
-
How and why does tomato accumulate a large amount of GABA in the fruit?Front Plant Sci. 2015 Aug 10;6:612. doi: 10.3389/fpls.2015.00612. eCollection 2015. Front Plant Sci. 2015. PMID: 26322056 Free PMC article. Review.
-
Inhibition of 2-oxoglutarate dehydrogenase in potato tuber suggests the enzyme is limiting for respiration and confirms its importance in nitrogen assimilation,Plant Physiol. 2008 Dec;148(4):1782-96. doi: 10.1104/pp.108.126219. Epub 2008 Oct 8. Plant Physiol. 2008. PMID: 18842826 Free PMC article.
-
Antisense inhibition of the iron-sulphur subunit of succinate dehydrogenase enhances photosynthesis and growth in tomato via an organic acid-mediated effect on stomatal aperture.Plant Cell. 2011 Feb;23(2):600-27. doi: 10.1105/tpc.110.081224. Epub 2011 Feb 9. Plant Cell. 2011. PMID: 21307286 Free PMC article.
-
Lipoate-Protein Ligase and Octanoyltransferase Are Essential for Protein Lipoylation in Mitochondria of Arabidopsis.Plant Physiol. 2014 Jul;165(3):978-990. doi: 10.1104/pp.114.238311. Epub 2014 May 28. Plant Physiol. 2014. PMID: 24872381 Free PMC article.
References
-
- Alba R, Fei Z, Payton P, Liu Y, Moore SL, Debbie P, Cohn J, D'Ascenzo GJS, Rose JKC, Martin G, et al (2004) ESTs, cDNA microarrays, and gene expression profiling: tools for dissecting plant physiology and development. Plant J 39 697–714 - PubMed
-
- ap Rees T, Hill SA (1994) Metabolic control analysis of plant metabolism. Plant Cell Environ 17 587–599
-
- Bartoli CG, Gomez F, Gergoff G, Guiamet JJ, Puntarulo S (2005) Up-regulation of the mitochondrial alternative oxidase pathway enhances photosynthetic electron transport under drought conditions. J Exp Bot 56 1269–1276 - PubMed
Publication types
MeSH terms
Substances
LinkOut - more resources
Full Text Sources
Other Literature Sources
