

MR imaging of metronidazole-induced encephalopathy: lesion distribution and diffusion-weighted imaging findings
- PMID: 17885234
- PMCID: PMC8134211
- DOI: 10.3174/ajnr.A0655
MR imaging of metronidazole-induced encephalopathy: lesion distribution and diffusion-weighted imaging findings
Abstract
Background and purpose: MR imaging features of metronidazole-induced encephalopathy (MIE) have not been fully established. This study was undertaken to determine the topographic distributions and diffusion-weighted imaging (DWI) findings of MIE.
Materials and methods: We retrospectively evaluated the initial MR images (n = 7), including DWI (n = 5), and follow-up MR images (n = 4) after drug discontinuation in 7 patents with clinically diagnosed MIE. The topographic distributions of lesions were evaluated on MR images, and DWI signal intensities and apparent diffusion coefficient (ADC) values of the lesions were assessed.
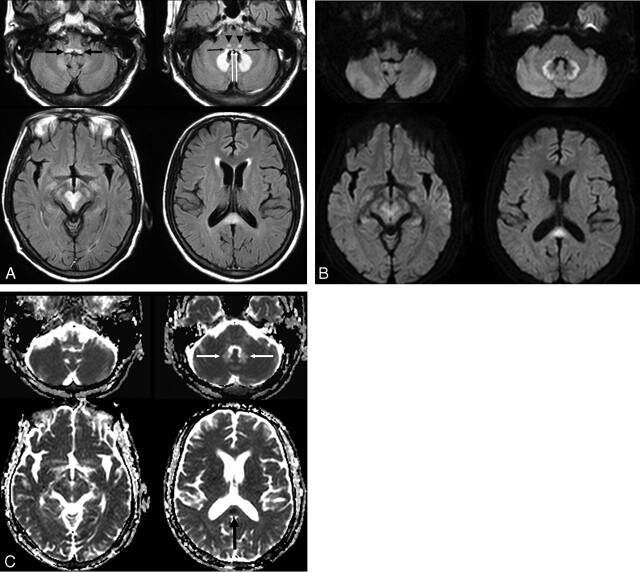
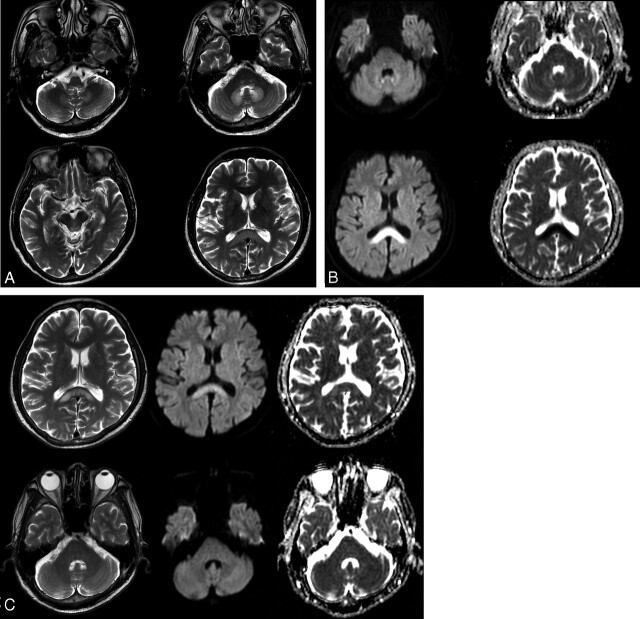
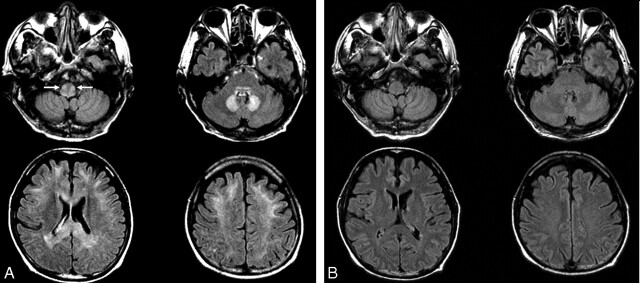
Results: MR images demonstrated bilateral symmetric T2 hyperintense lesions in the cerebellar dentate nucleus (n = 7), midbrain (n = 7), dorsal pons (n = 6), medulla (n = 4), corpus callosum (n = 4), and cerebral white matter (n = 1). Brain stem lesions involved the following: tectum (n = 5), tegmentum (n = 4), red nucleus (n = 3) of the midbrain, vestibular nucleus (n = 6), and a focal tegmental lesion involving the superior olivary nucleus (n = 6) and abducens nucleus (n = 4) of the pons and vestibular nucleus (n = 4) and inferior olivary nucleus (n = 1) of the medulla. DWI (n = 5) showed isointensity or hyperintensity of lesions, and the decreased ADC value was found only in the corpus callosum lesions (n = 2). All detected lesions were completely reversible at follow-up except for the single corpus callosum lesion with an initial low ADC value.
Conclusion: Brain lesions were typically located at the cerebellar dentate nucleus, midbrain, dorsal pons, medulla, and splenium of the corpus callosum. According to DWI, most of the lesions in MIE probably corresponded to areas of vasogenic edema, whereas only some of them, located in the corpus callosum, corresponded to cytotoxic edema.
Figures
Comment in
-
Metronidazole-induced and Wernicke encephalopathy: two different entities sharing the same metabolic pathway?AJNR Am J Neuroradiol. 2008 Oct;29(9):E84; author reply E85. doi: 10.3174/ajnr.A1142. Epub 2008 Jun 19. AJNR Am J Neuroradiol. 2008. PMID: 18566011 Free PMC article. No abstract available.
References
-
- Freeman CD, Klutman NE, Lamp KC. Metronidazole: a therapeutic review and update. Drugs 1997;54:679–708 - PubMed
-
- Frytak S, Moertel CH, Childs DS. Neurologic toxicity associated with high-dose metronidazole therapy. Ann Intern Med 1978;88:361–62 - PubMed
-
- Snavely SR, Hodges GR. The neurotoxicity of antibacterial agents. Ann Intern Med 1984;101:92–104 - PubMed
-
- Wright KH, Tyler JW. Recognizing metronidazole toxicosis in dogs. Vet Med 2003;98:410–18
MeSH terms
Substances
LinkOut - more resources
Full Text Sources
Medical