

Alternative splicing of c-fos pre-mRNA: contribution of the rates of synthesis and degradation to the copy number of each transcript isoform and detection of a truncated c-Fos immunoreactive species
- PMID: 17888145
- PMCID: PMC2098773
- DOI: 10.1186/1471-2199-8-83
Alternative splicing of c-fos pre-mRNA: contribution of the rates of synthesis and degradation to the copy number of each transcript isoform and detection of a truncated c-Fos immunoreactive species
Abstract
Background: Alternative splicing is a widespread mechanism of gene expression regulation. Previous analyses based on conventional RT-PCR reported the presence of an unspliced c-fos transcript in several mammalian systems. Compared to the well-defined knowledge on the alternative splicing of fosB, the physiological relevance of the unspliced c-fos transcript in regulating c-fos expression remains largely unknown. This work aimed to investigate the functional significance of the alternative splicing c-fos pre-mRNA.
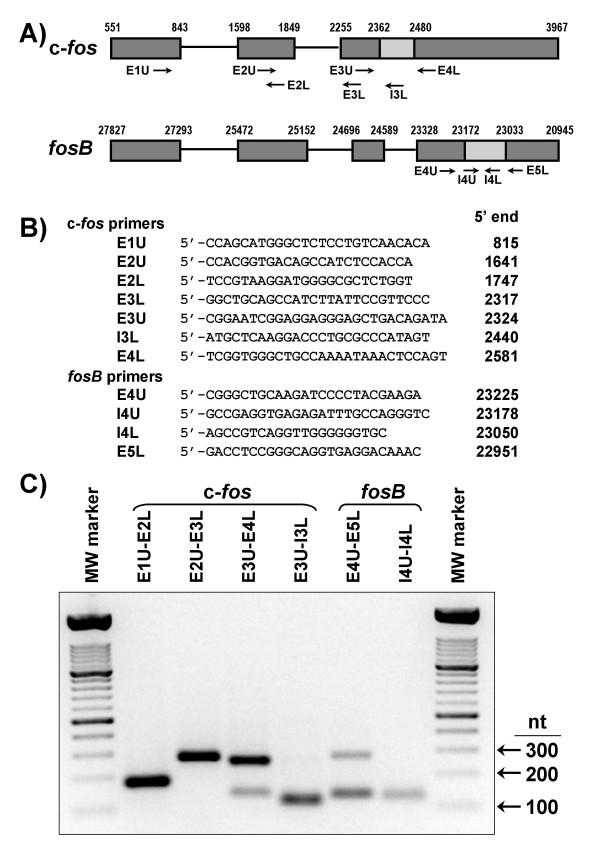
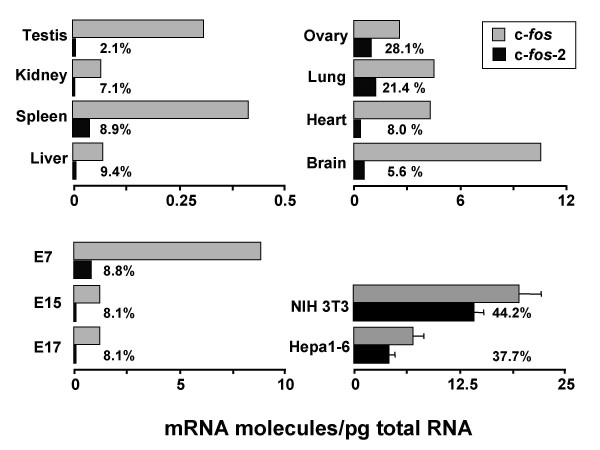
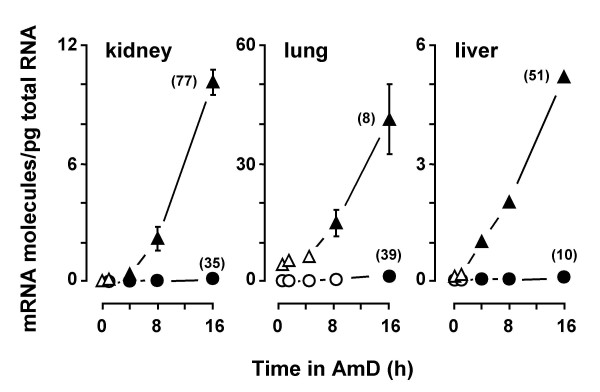
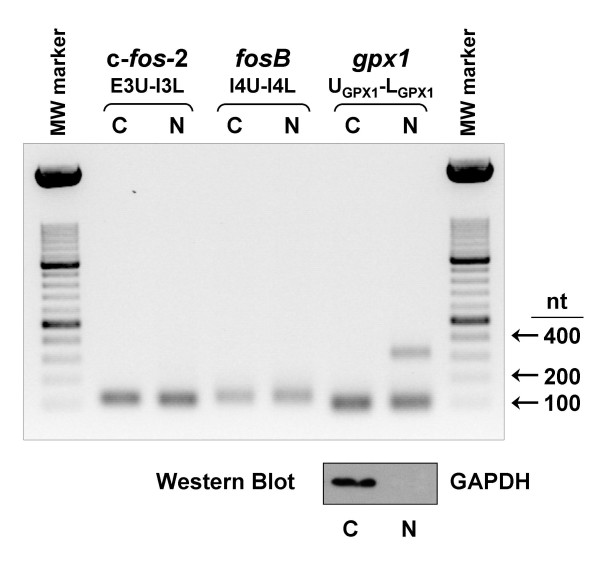
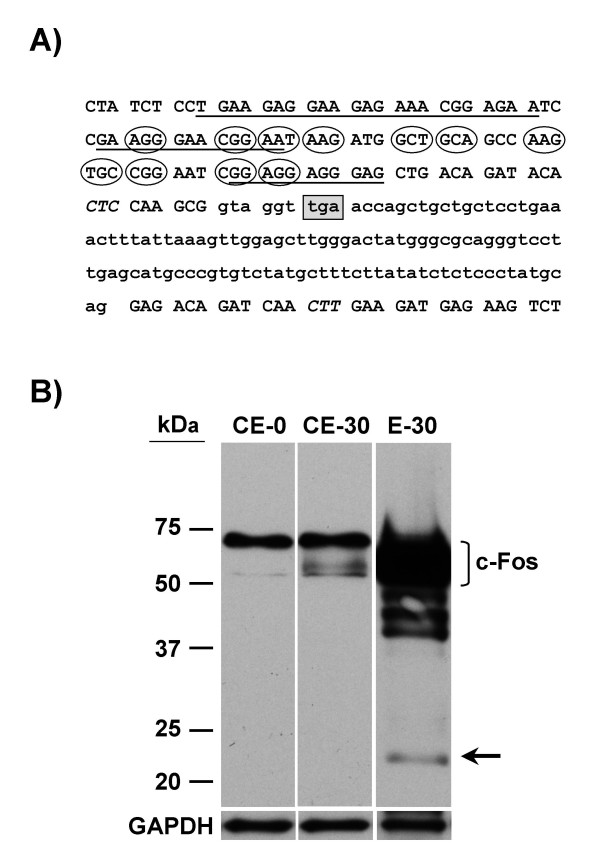
Results: A set of primers was designed to demonstrate that, whereas introns 1 and 2 are regularly spliced from primary c-fos transcript, intron 3 remains unspliced in part of total transcript molecules. Here, the two species are referred to as c-fos-2 (+ intron 3) and spliced c-fos (- intron 3) transcripts. Then, we used a quantitatively rigorous approach based on real-time PCR to provide, for the first time, the actual steady-state copy numbers of the two c-fos transcripts. We tested how the mouse-organ context and mouse-gestational age, the synthesis and turnover rates of the investigated transcripts, and the serum stimulation of quiescent cells modulate their absolute-expression profiles. Intron 3 generates an in-frame premature termination codon that predicts the synthesis of a truncated c-Fos protein. This prediction was evaluated by immunoaffinity chromatography purification of c-Fos proteins.
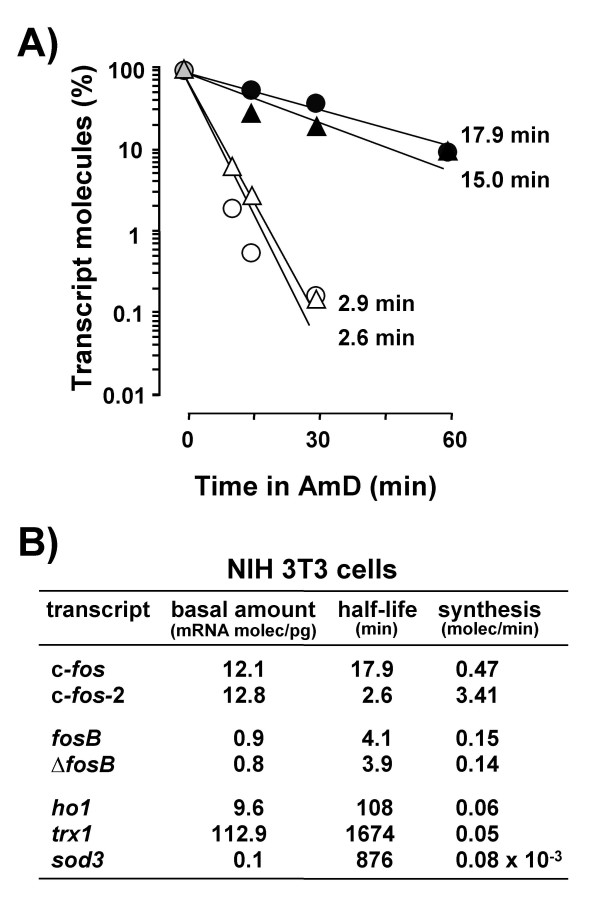
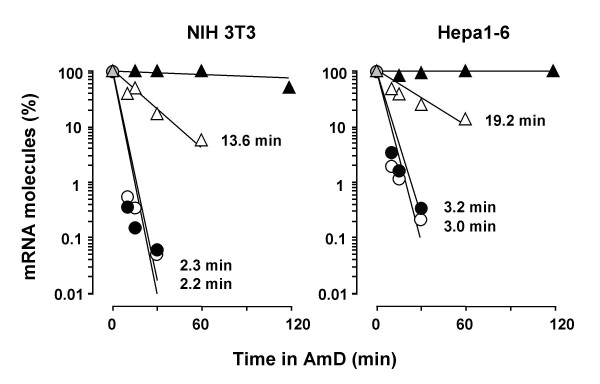
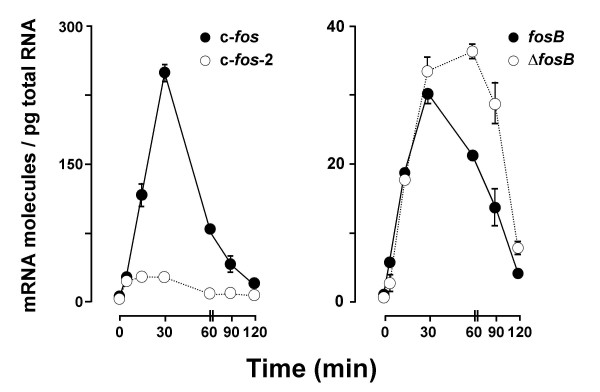
Conclusion: We demonstrate that: (i) The c-fos-2 transcript is ubiquitously synthesized either in vivo or in vitro, in amounts that are higher or similar to those of mRNAs coding for other Fos family members, like FosB, DeltaFosB, Fra-1 or Fra-2. (ii) Intron 3 confers to c-fos-2 an outstanding destabilizing effect of about 6-fold. (iii) Major determinant of c-fos-2 steady-state levels in cultured cells is its remarkably high rate of synthesis. (iv) Rapid changes in the synthesis and/or degradation rates of both c-fos transcripts in serum-stimulated cells give rise to rapid and transient changes in their relative proportions. Taken as a whole, these findings suggest a co-ordinated fine-tune of the two c-fos transcript species, supporting the notion that the alternative processing of the precursor mRNA might be physiologically relevant. Moreover, we detected a c-Fos immunoreactive species corresponding in mobility to the predicted truncated variant.
Figures
Similar articles
-
Cis-acting intronic elements that regulate cartilage-specific alternative splicing of the type II collagen (Col2) pre-mRNA lie at or near splice site junction sequences flanking exon 2 of the gene.J Bone Miner Res. 2003 Sep;18(9):1716-22. doi: 10.1359/jbmr.2003.18.9.1716. J Bone Miner Res. 2003. PMID: 12968682
-
Alternative pre-mRNA splicing in Drosophila spliceosomal assembly factor RNP-4F during development.Gene. 2006 Apr 26;371(2):234-45. doi: 10.1016/j.gene.2005.12.025. Epub 2006 Feb 23. Gene. 2006. PMID: 16497447
-
Altered myc gene transcription and intron-induced stabilization of myc RNAs in two mouse plasmacytomas.Oncogene. 1989 May;4(5):615-23. Oncogene. 1989. PMID: 2657576
-
Function of alternative splicing.Gene. 2005 Jan 3;344:1-20. doi: 10.1016/j.gene.2004.10.022. Epub 2004 Dec 10. Gene. 2005. PMID: 15656968 Review.
-
[Molecular mechanism of mRNA alternative splicing].Yi Chuan Xue Bao. 2004 Jan;31(1):102-7. Yi Chuan Xue Bao. 2004. PMID: 15468927 Review. Chinese.
Cited by
-
GPX2 Gene Affects Feed Efficiency of Pigs by Inhibiting Fat Deposition and Promoting Muscle Development.Animals (Basel). 2022 Dec 14;12(24):3528. doi: 10.3390/ani12243528. Animals (Basel). 2022. PMID: 36552449 Free PMC article.
-
Cellular responses to HSV-1 infection are linked to specific types of alterations in the host transcriptome.Sci Rep. 2016 Jun 29;6:28075. doi: 10.1038/srep28075. Sci Rep. 2016. PMID: 27354008 Free PMC article.
-
Choice for Drug or Natural Reward Engages Largely Overlapping Neuronal Ensembles in the Infralimbic Prefrontal Cortex.J Neurosci. 2018 Apr 4;38(14):3507-3519. doi: 10.1523/JNEUROSCI.0026-18.2018. Epub 2018 Feb 26. J Neurosci. 2018. PMID: 29483279 Free PMC article.
-
Fasciola hepatica induces Foxp3 T cell, proinflammatory and regulatory cytokine overexpression in liver from infected sheep during early stages of infection.Vet Res. 2018 Jul 3;49(1):56. doi: 10.1186/s13567-018-0550-x. Vet Res. 2018. PMID: 29970179 Free PMC article.
-
Evaluation of Th1/Th2, regulatory cytokines and transcriptional factor FoxP3 in sheep immunized with a partially protective and non-protective vaccine and challenged with Fasciola hepatica.Vet Res. 2024 Apr 24;55(1):53. doi: 10.1186/s13567-024-01308-8. Vet Res. 2024. PMID: 38658996 Free PMC article.
References
-
- Greenberg ME, Greene LA, Ziff EB. Nerve growth factor and epidermal growth factor induce rapid transient changes in proto-oncogene transcription in PC12 cells. J Biol Chem. 1985;260:14101–14110. - PubMed
Publication types
MeSH terms
Substances
LinkOut - more resources
Full Text Sources
Other Literature Sources
Miscellaneous
