

The HIV RNA setpoint theory revisited
- PMID: 17888148
- PMCID: PMC2206052
- DOI: 10.1186/1742-4690-4-65
The HIV RNA setpoint theory revisited
Abstract
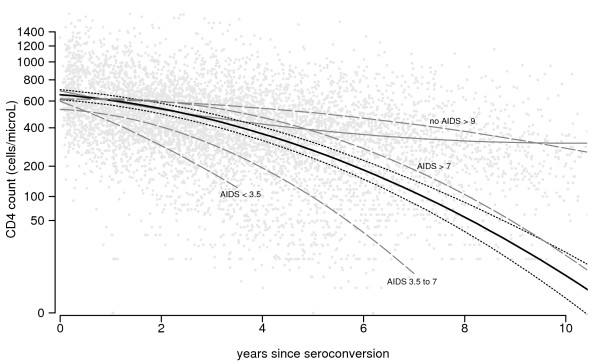
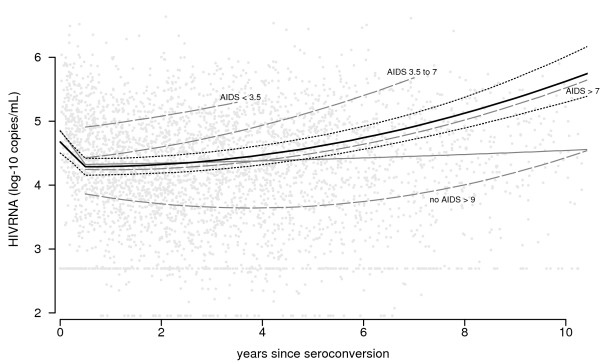
Background: The evolution of plasma viral load after HIV infection has been described as reaching a setpoint, only to start rising again shortly before AIDS diagnosis. In contrast, CD4 T-cell count is considered to show a stable decrease. However, characteristics of marker evolution over time depend on the scale that is used to visualize trends. In reconsidering the setpoint theory for HIV RNA, we analyzed the evolution of CD4 T-cell count and HIV-1 RNA level from HIV seroconversion to AIDS diagnosis. Follow-up data were used from two cohort studies among homosexual men (N = 400), restricting to the period before highly active antiretroviral therapy became widely available (1984 until 1996). Individual trajectories of both markers were fitted and averaged, both from seroconversion onwards and in the four years preceding AIDS diagnosis, using a bivariate random effects model. Both markers were evaluated on a scale that is directly related to AIDS risk.
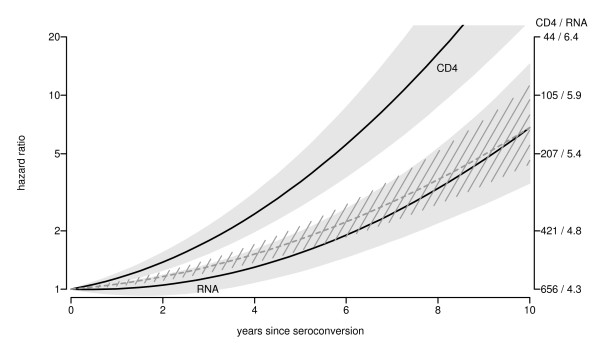
Results: Individuals with faster AIDS progression had higher HIV RNA level six months after seroconversion. For CD4 T-cell count, this ordering was less clearly present. However, HIV RNA level and CD4 T-cell count showed qualitatively similar evolution over time after seroconversion, also when stratified by rate of progression to AIDS. In the four years preceding AIDS diagnosis, a non-significant change in HIV RNA increase was seen, whereas a significant biphasic pattern was present for CD4 T-cell decline.
Conclusion: HIV RNA level has more setpoint behaviour than CD4 T-cell count as far as the level shortly after seroconversion is concerned. However, with respect to the, clinically more relevant, marker evolution over time after seroconversion, a setpoint theory holds as much for CD4 T-cell count as for HIV RNA level.
Figures
Similar articles
-
AIDS prognosis based on HIV-1 RNA, CD4+ T-cell count and function: markers with reciprocal predictive value over time after seroconversion.AIDS. 1997 Dec;11(15):1799-806. doi: 10.1097/00002030-199715000-00003. AIDS. 1997. PMID: 9412697
-
Viral load and CD4 count dynamics after HIV-1 seroconversion in homosexual and bisexual men in Rio de Janeiro, Brazil.J Acquir Immune Defic Syndr. 2006 Dec 1;43(4):401-4. doi: 10.1097/01.qai.0000243117.21788.90. J Acquir Immune Defic Syndr. 2006. PMID: 17031316
-
Body mass index course in asymptomatic HIV-infected homosexual men and the predictive value of a decrease of body mass index for progression to AIDS.J Acquir Immune Defic Syndr Hum Retrovirol. 1998 Nov 1;19(3):254-9. doi: 10.1097/00042560-199811010-00007. J Acquir Immune Defic Syndr Hum Retrovirol. 1998. PMID: 9803967
-
Association of HLA profiles with early plasma viral load, CD4+ cell count and rate of progression to AIDS following acute HIV-1 infection. Multicenter AIDS Cohort Study.AIDS. 1998 Nov 12;12(16):2107-13. doi: 10.1097/00002030-199816000-00005. AIDS. 1998. PMID: 9833851
-
Time-updated CD4+ T lymphocyte count and HIV RNA as major markers of disease progression in naive HIV-1-infected patients treated with a highly active antiretroviral therapy: the Aquitaine cohort, 1996-2001.J Acquir Immune Defic Syndr. 2003 Jul 1;33(3):380-6. doi: 10.1097/00126334-200307010-00013. J Acquir Immune Defic Syndr. 2003. PMID: 12843750
Cited by
-
Pandemic HIV-1 Vpu overcomes intrinsic herd immunity mediated by tetherin.Sci Rep. 2015 Jul 17;5:12256. doi: 10.1038/srep12256. Sci Rep. 2015. PMID: 26184634 Free PMC article.
-
CD4+ cell dynamics in untreated HIV-1 infection: overall rates, and effects of age, viral load, sex and calendar time.AIDS. 2015 Nov 28;29(18):2435-46. doi: 10.1097/QAD.0000000000000854. AIDS. 2015. PMID: 26558543 Free PMC article.
-
Viral load levels measured at set-point have risen over the last decade of the HIV epidemic in the Netherlands.PLoS One. 2009 Oct 7;4(10):e7365. doi: 10.1371/journal.pone.0007365. PLoS One. 2009. PMID: 19809510 Free PMC article.
-
Transmission selects for HIV-1 strains of intermediate virulence: a modelling approach.PLoS Comput Biol. 2011 Oct;7(10):e1002185. doi: 10.1371/journal.pcbi.1002185. Epub 2011 Oct 13. PLoS Comput Biol. 2011. PMID: 22022243 Free PMC article.
-
High heritability is compatible with the broad distribution of set point viral load in HIV carriers.PLoS Pathog. 2015 Feb 6;11(2):e1004634. doi: 10.1371/journal.ppat.1004634. eCollection 2015 Feb. PLoS Pathog. 2015. PMID: 25658741 Free PMC article.
References
-
- de Wolf F, Spijkerman I, Schellekens PT, Langendam M, Kuiken C, Bakker M, Roos M, Coutinho R, Miedema F, Goudsmit J. AIDS prognosis based on HIV-1 RNA, CD4+ T-cell count and function: markers with reciprocal predictive value over time since seroconversion. AIDS. 1997;11:1799–1806. doi: 10.1097/00002030-199715000-00003. - DOI - PubMed
-
- Katzenstein TL, Pedersen C, Nielsen C, Lundgren JD, Jakobsen PH, Gerstoft J. Longitudinal serum HIV RNA quantification: Correlation to viral phenotype at seroconversion and clinical outcome. AIDS. 1996;10:167–173. - PubMed
Publication types
MeSH terms
Substances
LinkOut - more resources
Full Text Sources
Medical
Research Materials
