. 2007 Dec;7(6):374-85.
doi: 10.1016/j.mito.2007.08.001. Epub 2007 Aug 16.

Convergence of multiple signaling pathways is required to coordinately up-regulate mtDNA and mitochondrial biogenesis during T cell activation

Affiliations

Convergence of multiple signaling pathways is required to coordinately up-regulate mtDNA and mitochondrial biogenesis during T cell activation

Anthony D D'Souza et al. Mitochondrion. 2007 Dec.

Abstract

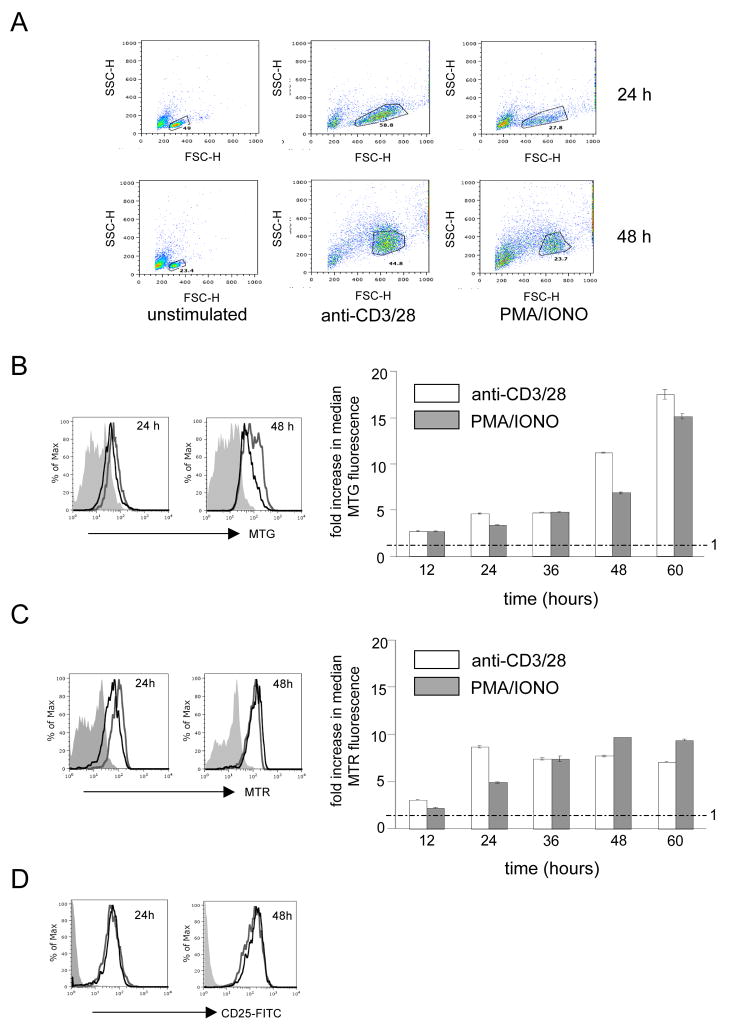
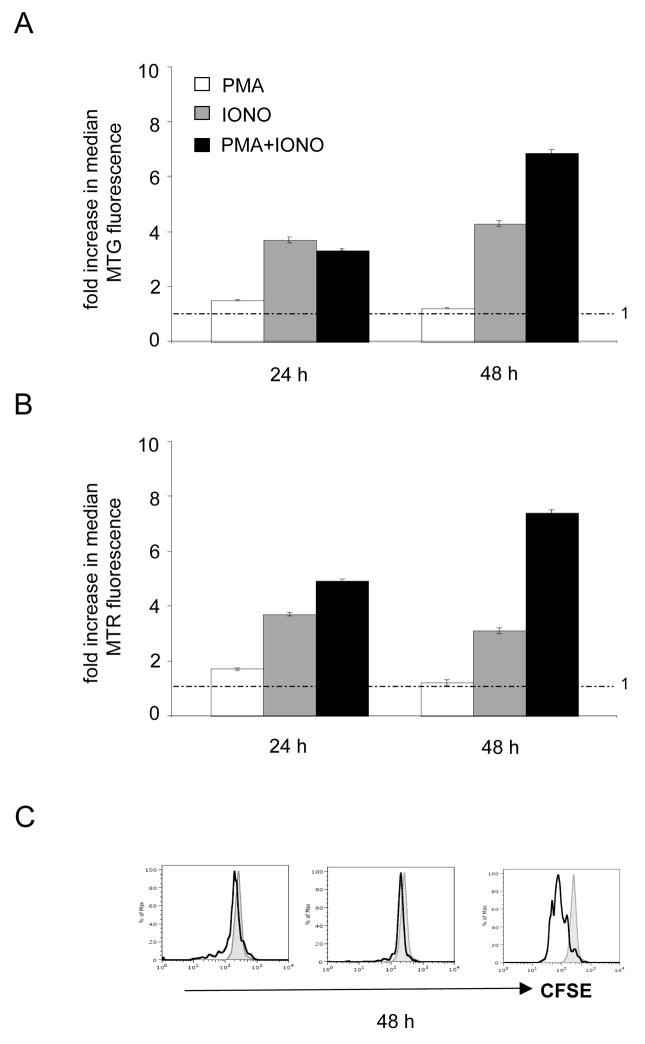
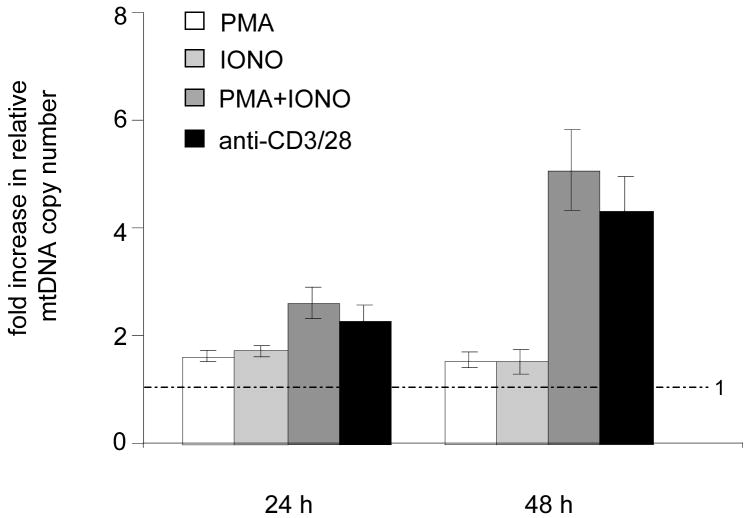
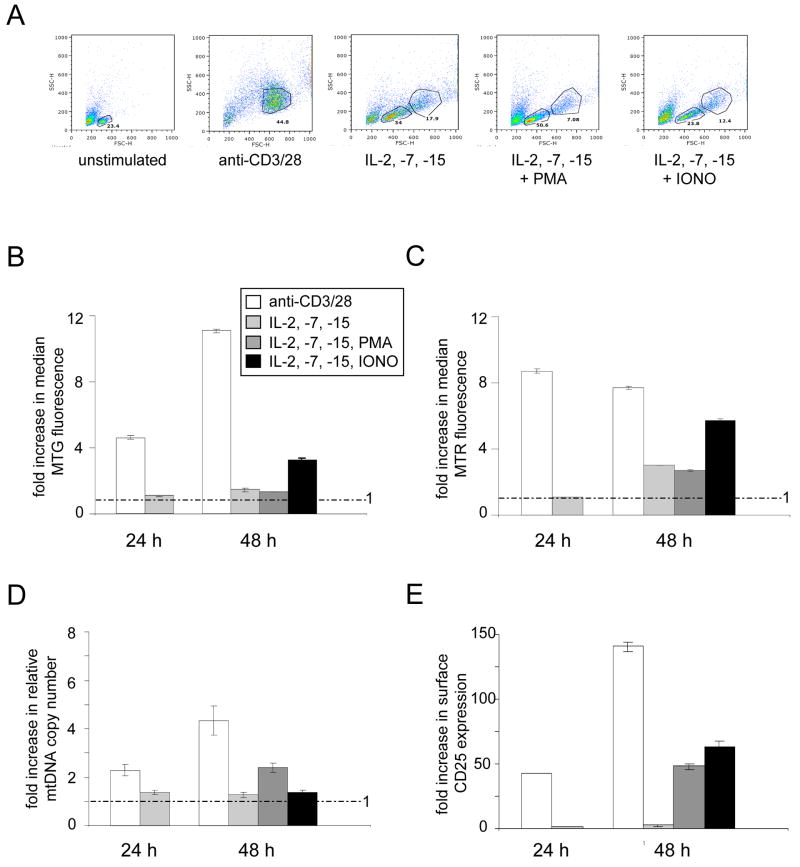
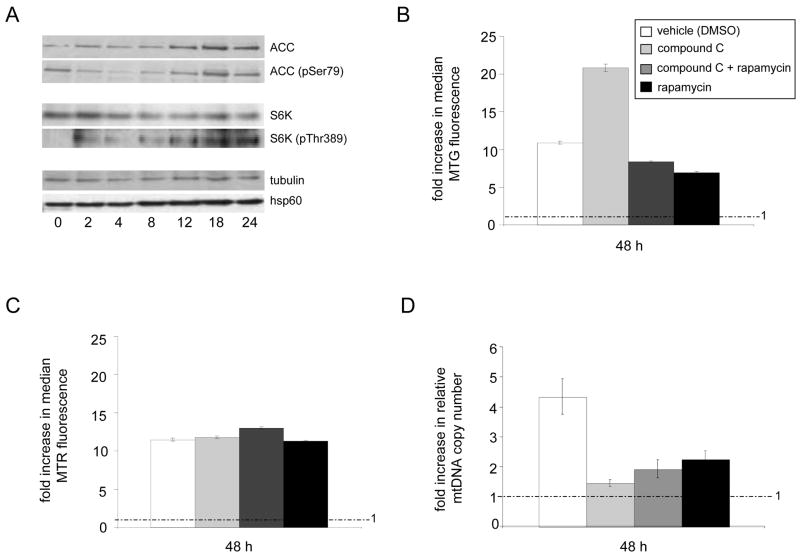
The quantity and activity of mitochondria vary dramatically in tissues and are modulated in response to changing cellular energy demands and environmental factors. The amount of mitochondrial DNA (mtDNA), which encodes essential subunits of the oxidative phosphorylation complexes required for cellular ATP production, is also tightly regulated, but by largely unknown mechanisms. Using murine T cells as a model system, we have addressed how specific signaling pathways influence mitochondrial biogenesis and mtDNA copy number. T cell receptor (TCR) activation results in a large increase in mitochondrial mass and membrane potential and a corresponding amplification of mtDNA, consistent with a vital role for mitochondrial function for growth and proliferation of these cells. Independent activation of protein kinase C (via PMA) or calcium-related pathways (via ionomycin) had differential and sub-maximal effects on these mitochondrial parameters, as did activation of naïve T cells with proliferative cytokines. Thus, the robust mitochondrial biogenesis response observed upon TCR activation requires synergy of multiple downstream signaling pathways. One such pathway involves AMP-activated protein kinase (AMPK), which we show has an unprecedented role in negatively regulating mitochondrial biogenesis that is mammalian target of rapamycin (mTOR)-dependent. That is, inhibition of AMPK after TCR signaling commences results in excessive, but uncoordinated mitochondrial proliferation. Thus mitochondrial biogenesis is not under control of a single master regulatory circuit, but rather requires the convergence of multiple signaling pathways with distinct downstream consequences on the organelle's structure, composition, and function.


Figures

Figure 1
Figure 1. Up-regulation of mitochondrial mass and mitochondrial potential during TCR stimulation of murine splenic T cells
A. Representative FACS plots showing comparative FSC vs. SSC profiles of unstimulated, anti-CD3/28 and PMA/IONO stimulated T cells at 24 and 48 hours, respectively. The “live cell” gates used for analyses are shown. B. FACS analysis of Mitotracker green (MTG) staining for mitochondrial mass. C. FACS analysis of Mitotracker Red (MTR) staining for mitochondrial membrane potential. D. FACS analysis of CD25 staining, a marker for activated T cells. For B.–D. representative histograms comparing the fluorescence intensity (increasing from left to right as indicated by the arrow) of unstimulated (filled gray), anti-CD3/28 stimulated (open gray) and PMA/IONO stimulated (open black) cells at 24 and 48h are shown. For B. and C., a bar graph is also shown to the right that summarizes the fold-increase in the mean fluorescence intensity (MFI) during anti-CD3/28 (open) and PMA/IONO (filled gray) stimulations at 12, 24, 36, 48 and 60h relative to the unstimulated control sample. All plots show the mean+/− SD (brackets) calculated from triplicate samples. The dotted line across the graph denotes the mean MFI value of unstimulated cells, which was given a value of 1.0. Hence, a fold change of 1.0 indicates no effect.
Figure 2
Figure 2. Synergy between PMA-activated and ionomycin activated calcium-related signaling pathways is required for maximal mitochondrial biogenesis in response to T cell activation
FACS analysis of T cells stimulated with PMA, ionomycin (IONO) or both is shown at the time point after stimulation indicated. A. Analysis of Mitotracker green (MTG) staining for mitochondrial mass. B. Analysis of Mitotracker green (MTG) staining for mitochondrial membrane potential. C. Analysis of CFSE staining at 72 hours post-stimulation. Reduced staining is an indicator of cell division.
Figure 3
Figure 3. Up-regulation of mtDNA copy number upon TCR stimulation also requires multiple synergistic pathways
A real-time PCR assay that measures the amount of mtDNA relative to nuclear DNA was employed in activated mouse T cells. Plotted is the fold increase in the relative mtDNA copy number (mtDNA/nuclear DNA ratio) in T cells stimulated by PMA alone (open bars), ionomycin (IONO) alone (filled light gray), PMA and IONO (filled dark gray), and anti-CD3/CD28 (filled black) at 24 and 48 hours post-stimulation. All plots show mean +/− SD (brackets) calculated from triplicate samples. The dotted line across the graph denotes the mean relative mtDNA copy number of unstimulated control cells, which were given a value of 1.0.
Figure 4
Figure 4. Stimulation of naïve T cell proliferation with cytokines results in minimal mitochondrial biogenesis that can be activated differentially by addition of PMA or ionomycin
A. Representative FACS plots showing comparative FSC vs. SSC profiles of naïve T cells either unstimulated or stimulated for 48 hours as indicated with anti-CD3/CD28 or a cocktail of the cytokines IL-2, IL-7 and IL-15 (with or without PMA or IONO). PMA and IONO were added after 24 hours of stimulation with the cytokines, therefore, the 48-hour time point is 24 hours after drug addition. These were analyzed for mitochondrial biogenesis and activity and mtDNA copy number and are presented exactly as described Figures 1 and 3. The inset in B. also corresponds to the data presented in C–E. B. FACS analysis of Mitotracker green (MTG) staining for mitochondrial mass. C. FACS analysis of Mitotracker Red (MTR) staining for mitochondrial membrane potential. D. Analysis of relative mtDNA copy number. E. FACS analysis of CD25 staining, a marker for activated T cells.
Figure 5
Figure 5. Differential and overlapping regulation of mitochondrial mass and mtDNA copy number by AMPK and mTOR
A. Western blots of acetyl-CoA carboxylase (ACC; a AMPK phosphorylation substrate) and p70-S6K (S6K; a mTOR phosphorylation substrate) at the indicated time (in hours) after TCR stimulation using anti-CD3/CD28 antibodies. T cells were stimulated for 12 hours in the presence (+) or absence (−) of the AMPK inhibitor (compound C, 10 μM), the mTOR inhibitor (rapamycin, 250 nM), or both. Western blots were probed using antibodies specific for the non-phosphorylated (ACC or S6K) or specific phosphorylated (ACC-pSer79 or S6K-pThr389) forms of the target substrates. Tubulin was probed as a control for protein loading and normalization. Analysis of Hsp60, a mitochondrial chaperone and marker of total mitochondrial biogenesis, is also shown. B–D. Analysis of mitochondrial mass (B), membrane potential (C) and mtDNA copy number (D) of TCR-activated T cells in the presence (+) and absence (−) of compound C, rapamycin, or both is shown. The inset in B. also corresponds to the data presented in C. and D. The FACS and mtDNA copy number results are shown as bar graphs as described in Figures 1 and 3.

References

    1. Akimoto T, Pohnert SC, Li P, Zhang M, Gumbs C, Rosenberg PB, Williams RS, Yan Z. Exercise stimulates Pgc-1alpha transcription in skeletal muscle through activation of the p38 MAPK pathway. J Biol Chem. 2005;280:19587–93. - PubMed
    1. Arsham AM, Neufeld TP. Thinking globally and acting locally with TOR. Curr Opin Cell Biol. 2006;18:589–97. - PubMed
    1. Bonawitz ND, Clayton DA, Shadel GS. Initiation and beyond: multiple functions of the human mitochondrial transcription machinery. Mol Cell. 2006;24:813–25. - PubMed
    1. Burton TR, Kashour T, Wright JA, Amara FM. Cellular signaling pathways affect the function of ribonucleotide reductase mRNA binding proteins: mRNA stabilization, drug resistance, and malignancy (Review) Int J Oncol. 2003;22:21–31. - PubMed
    1. Butow RA, Avadhani NG. Mitochondrial signaling: the retrograde response. Mol Cell. 2004;14:1–15. - PubMed

Publication types

MeSH terms

LinkOut - more resources