. 2008 Jan 15;94(2):702-13.
doi: 10.1529/biophysj.107.115121. Epub 2007 Sep 21.

Long-range nonanomalous diffusion of quantum dot-labeled aquaporin-1 water channels in the cell plasma membrane

Affiliations

Long-range nonanomalous diffusion of quantum dot-labeled aquaporin-1 water channels in the cell plasma membrane

Jonathan M Crane et al. Biophys J. .

Abstract

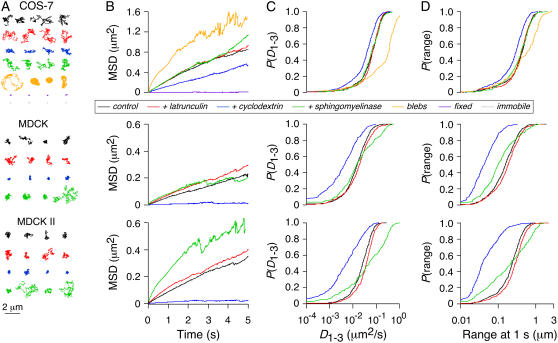
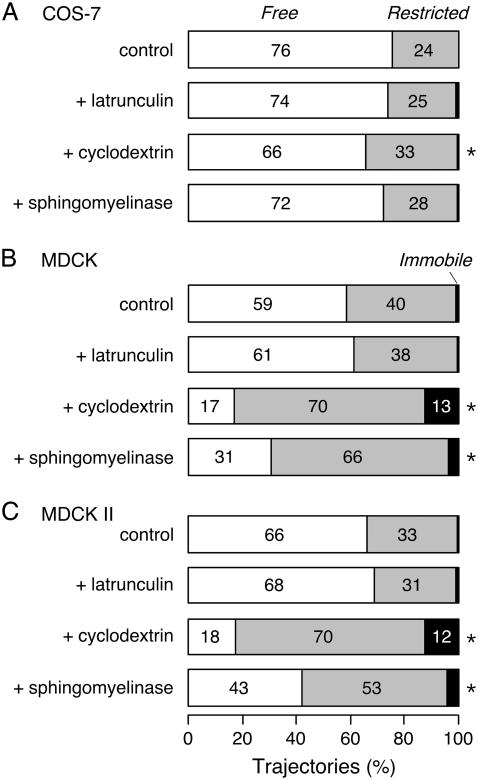
Aquaporin-1 (AQP1) is an integral membrane protein that facilitates osmotic water transport across cell plasma membranes in epithelia and endothelia. AQP1 has no known specific interactions with cytoplasmic or membrane proteins, but its recovery in a detergent-insoluble membrane fraction has suggested possible raft association. We tracked the membrane diffusion of AQP1 molecules labeled with quantum dots at an engineered external epitope at frame rates up to 91 Hz and over times up to 6 min. In transfected COS-7 cells, >75% of AQP1 molecules diffused freely over approximately 7 mum in 5 min, with diffusion coefficient, D(1-3) approximately 9 x 10(-10) cm(2)/s. In MDCK cells, approximately 60% of AQP1 diffused freely, with D(1-3) approximately 3 x 10(-10) cm(2)/s. The determinants of AQP1 diffusion were investigated by measurements of AQP1 diffusion following skeletal disruption (latrunculin B), lipid/raft perturbations (cyclodextrin and sphingomyelinase), and bleb formation. We found that cytoskeletal disruption had no effect on AQP1 diffusion in the plasma membrane, but that diffusion was increased greater than fourfold in protein de-enriched blebs. Cholesterol depletion in MDCK cells greatly restricted AQP1 diffusion, consistent with the formation of a network of solid-like barriers in the membrane. These results establish the nature and determinants of AQP1 diffusion in cell plasma membranes and demonstrate long-range nonanomalous diffusion of AQP1, challenging the prevailing view of universally anomalous diffusion of integral membrane proteins, and providing evidence against the accumulation of AQP1 in lipid rafts.


Figures

FIGURE 1
FIGURE 1
Labeling and time-lapse SPT of AQP1 in the plasma membrane. (A) Schematic of Qdot-labeled AQP1 monomer. Human c-myc epitope was inserted between residues T120 and G121 (red), which reside in the second extracellular loop (yellow), between transmembrane helices M4 and M5 (green). This site is well removed from the two NPA motifs (blue) that serve as the selectivity filter of the pore. (B) Labeling of AQP1.myc with high density of Qdots on the surface of live COS-7 (left) and MDCK (right) cells. (C) MDCK cells cotransfected with cytoplasmic GFP (green) and AQP1.myc, labeled at low density (as used for SPT measurements) with Qdots (red). Arrow points to cell expressing GFP without AQP1.myc. (D) Examples of trajectories from time-lapse SPT acquired at 1 Hz (total time, 6 min) overlaid onto fluorescence images of GFP in the cytoplasm of a COS-7 cell (left) and a MDCK cell (right). (E) Mean-squared displacement (MSD) versus time curves from all time-lapse SPT (∼300 individual trajectories averaged for each cell type).
FIGURE 2
FIGURE 2
SPT analysis of AQP1 at high time resolution (91 Hz). (A) Representative trajectories for AQP1 diffusing in the plasma membrane of COS-7 (top), MDCK (middle), and MDCK II (bottom) cells shown under control conditions (black), and after treatment with latrunculin (red), cyclodextrin (blue), or sphingomyelinase (green). For COS-7 cells, trajectories are also shown for paraformaldehyde-fixed cells (purple) and on the surface of membrane blebs (orange). Trajectories for Qdots immobilized on glass are shown for comparison (gray). (B) Corresponding combined MSD versus time curves for each cell type/maneuver shown. Cumulative probability distributions shown for AQP1 diffusion coefficient, D1-3 (C), and range at 1 s (D).
FIGURE 3
FIGURE 3
Relative deviation analysis of individual simulated trajectories. (A) Histograms of trajectory number for deduced RD(N,50) for simulated free (nonanomalous) diffusion with N = 100, 200, 300, 400, and 500. Vertical lines indicate 2.5th and 97.5th percentiles. (B) RD(N,50) versus N for simulations in panel A. Solid circles indicate 2.5th and 97.5th percentiles. (C) Application of RD analysis, RD(N,50), to simulated trajectories for free diffusion that included an uncertainty of 20 nm in x- and y-coordinates. (Left) Simulations done for free diffusion (solid curve), and diffusion confined within square domains with sides of length 0.2–0.6 μm (dotted curve) or 0.6–1.0 μm (dashed curve). Simulation parameters are: 1000 trajectories, N = 300, D = 0.1 μm2/s, δt = 10 ms. (Right) Computed fractions of trajectories classified as undergoing free diffusion (white) versus restricted diffusion (gray).
FIGURE 4
FIGURE 4
Classification of AQP1 trajectories by relative deviation analysis. RD(N,50) applied to experimental trajectories from AQP1 diffusion in COS-7 (A), MDCK (B), and MDCK II (C) cells. Percentage trajectories shown classified as free (white), restricted (gray), and immobile (black), following the indicated treatments. Immobile trajectories defined as those with range <18 nm after 100 frames. *Indicates P < 0.01 when compared to untreated cells.
FIGURE 5
FIGURE 5
Classification of AQP1 trajectories by analysis of cumulative distribution functions of square displacements. (A) Cumulative distributions of square displacements at 55 ms for COS-7 (left) and MDCK (right) cells. Fitting results to Eq. 6 and residuals, assuming a single Brownian fraction (f = 1, dotted curves) or two fractions (solid curves). (B) Comparison of CDF fit versus separation of individual MSDs by RD(N,50) (from Figs. 3 and 4). Fits to CDFs done at times nδt from n = 1 (11 ms) through n = 50 (550 ms). Resulting constants formula image and formula image shown as solid and open circles, respectively, compared with the combined MSDs of the trajectories defined as free (solid curve) or restricted (dotted curve) by RD(N,50). (C) Fraction f of the fast component (circles) compared to the fraction of MSDs defined as free (horizontal line) by RD(N,50).

Similar articles

Cited by

References

    1. Verkman, A. S. 2005. More than just water channels: unexpected cellular roles of aquaporins. J. Cell Sci. 118:3225–3232. - PubMed
    1. Verbavatz, J. M., D. Brown, I. Sabolic, G. Valenti, D. A. Ausiello, A. N. Van Hoek, T. Ma, and A. S. Verkman. 1993. Tetrameric assembly of CHIP28 water channels in liposomes and cell membranes: a freeze-fracture study. J. Cell Biol. 123:605–618. - PMC - PubMed
    1. Ren, G., A. Cheng, P. Melnyk, and A. K. Mitra. 2000. Polymorphism in the packing of aquaporin-1 tetramers in 2-D crystals. J. Struct. Biol. 130:45–53. - PubMed
    1. Sui, H., B. G. Han, J. K. Lee, P. Walian, and B. K. Jap. 2001. Structural basis of water-specific transport through the AQP1 water channel. Nature. 414:872–878. - PubMed
    1. Sabolic, I., G. Valenti, J. M. Verbavatz, A. N. Van Hoek, A. S. Verkman, D. A. Ausiello, and D. Brown. 1992. Localization of the CHIP28 water channel in rat kidney. Am. J. Physiol. 263:C1225–C1233. - PubMed

Publication types

LinkOut - more resources