. 2007 Oct;25(10):1165-70.
doi: 10.1038/nbt1340. Epub 2007 Sep 23.

Renal clearance of quantum dots

Affiliations

Renal clearance of quantum dots

Hak Soo Choi et al. Nat Biotechnol. 2007 Oct.

Abstract

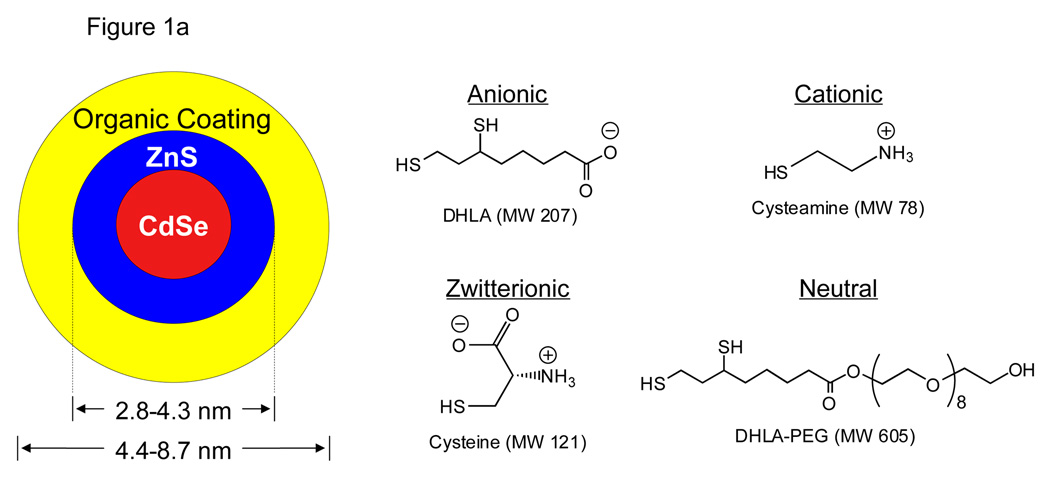
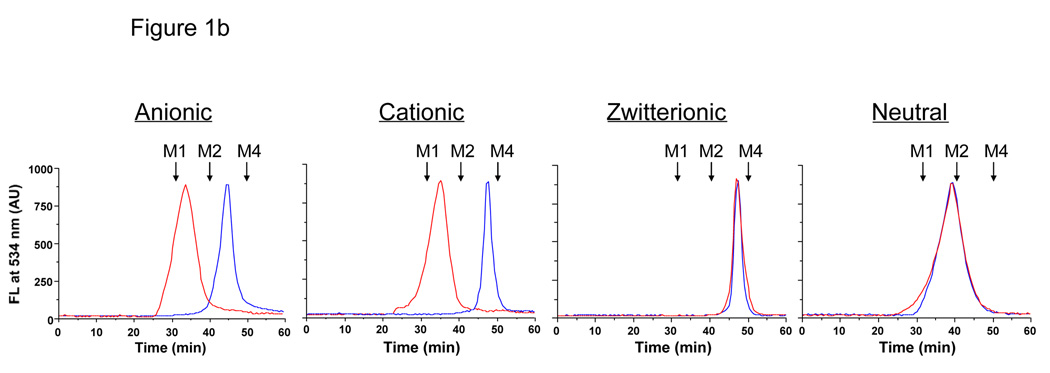
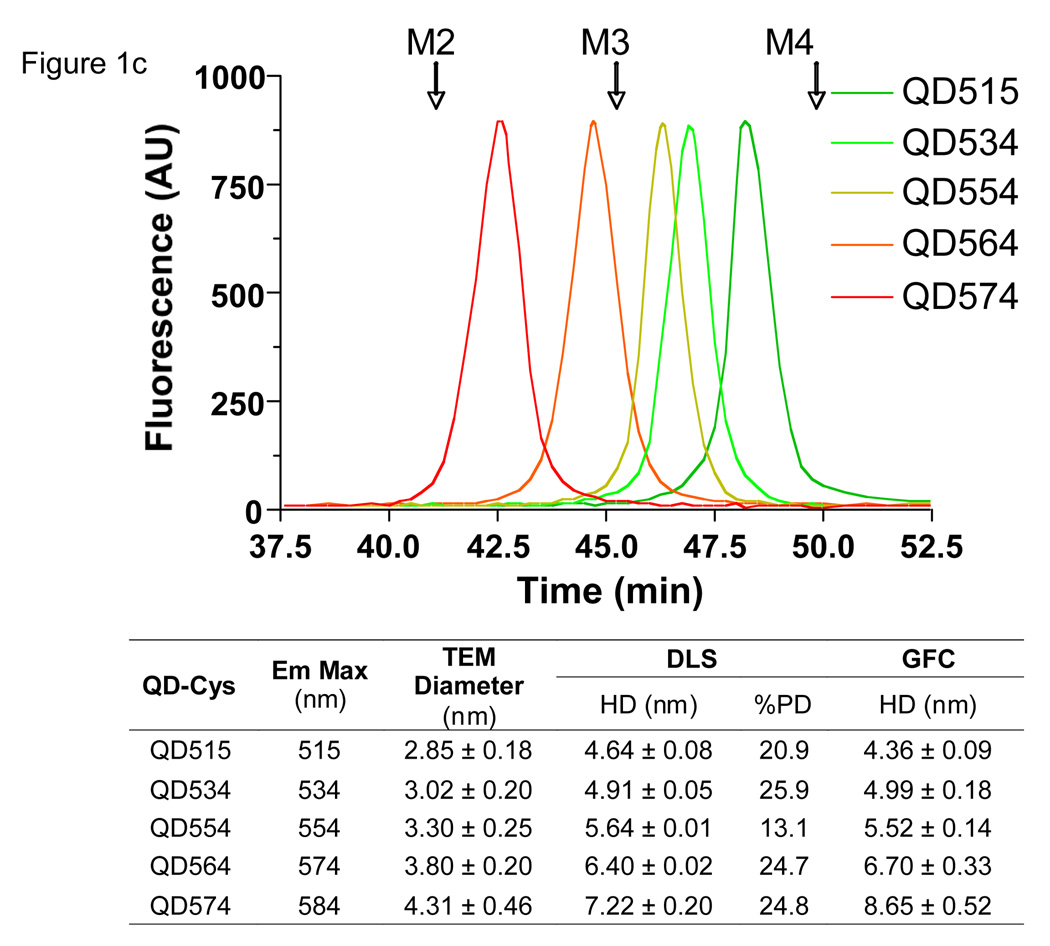
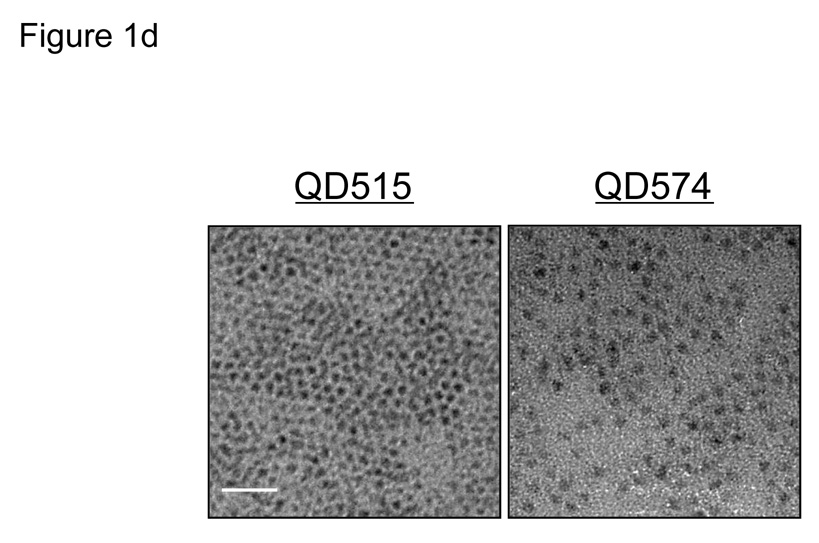
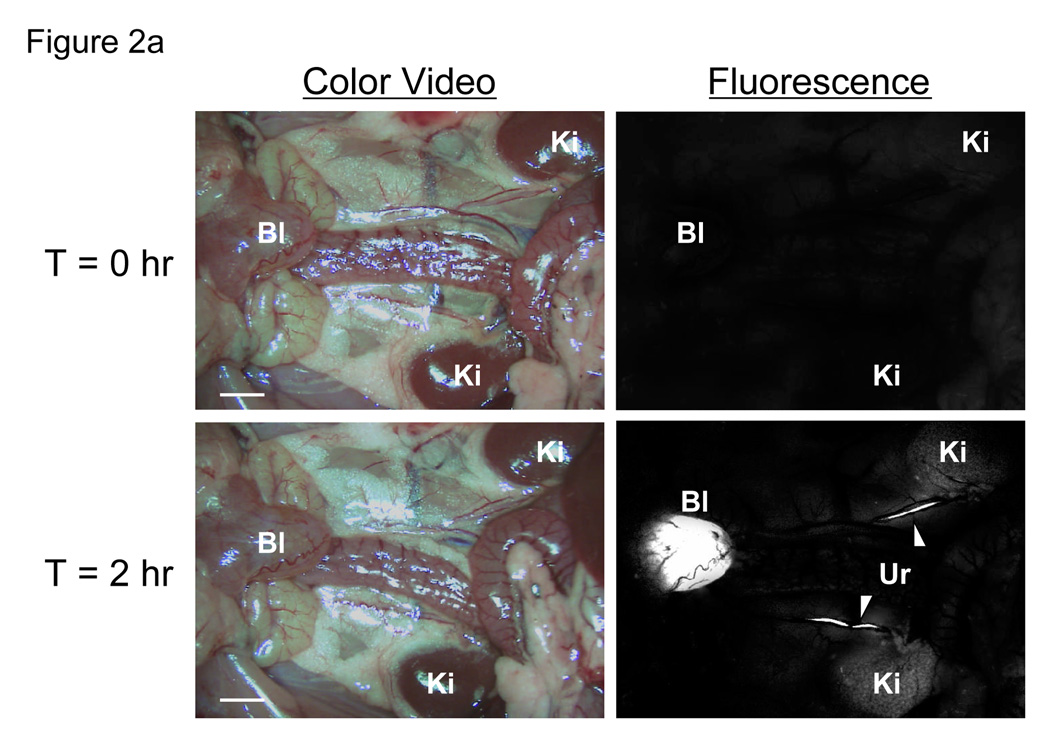
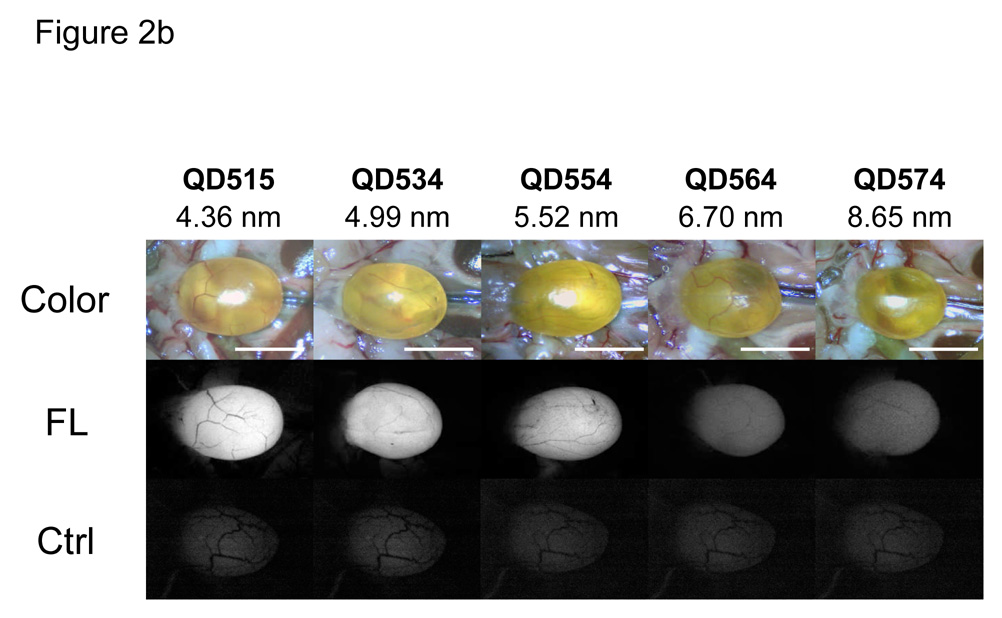
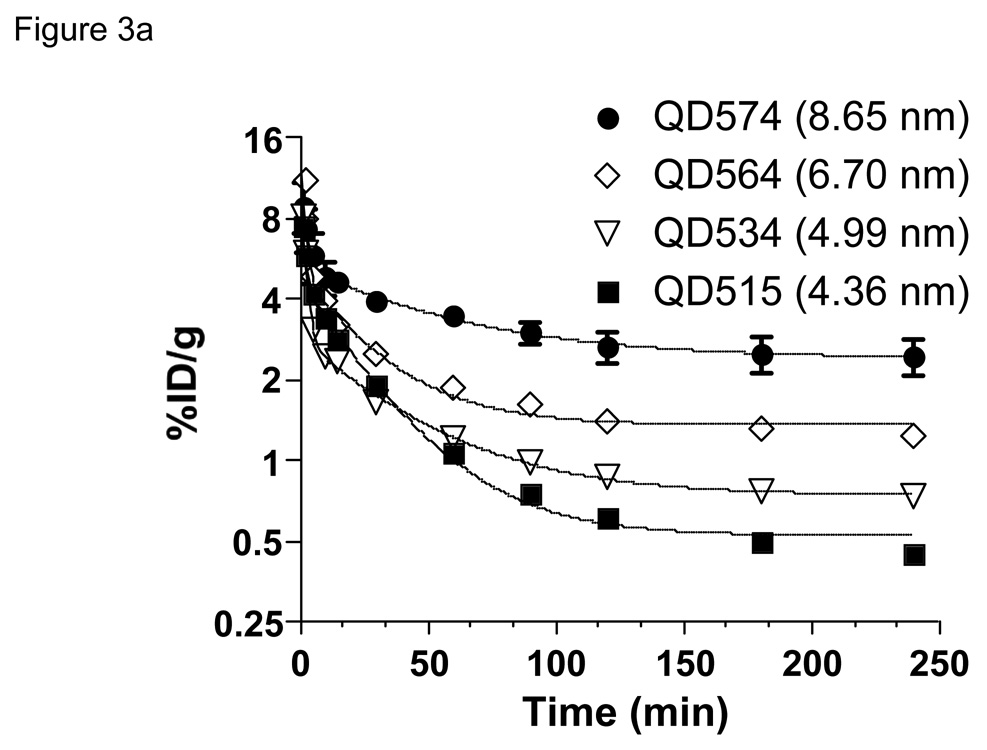
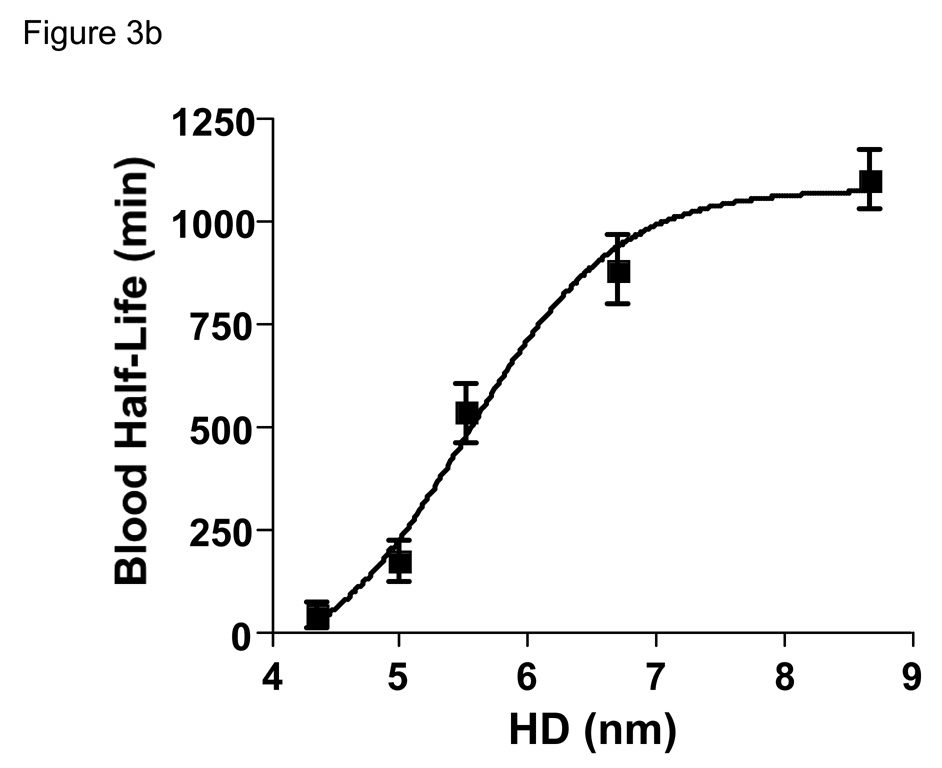
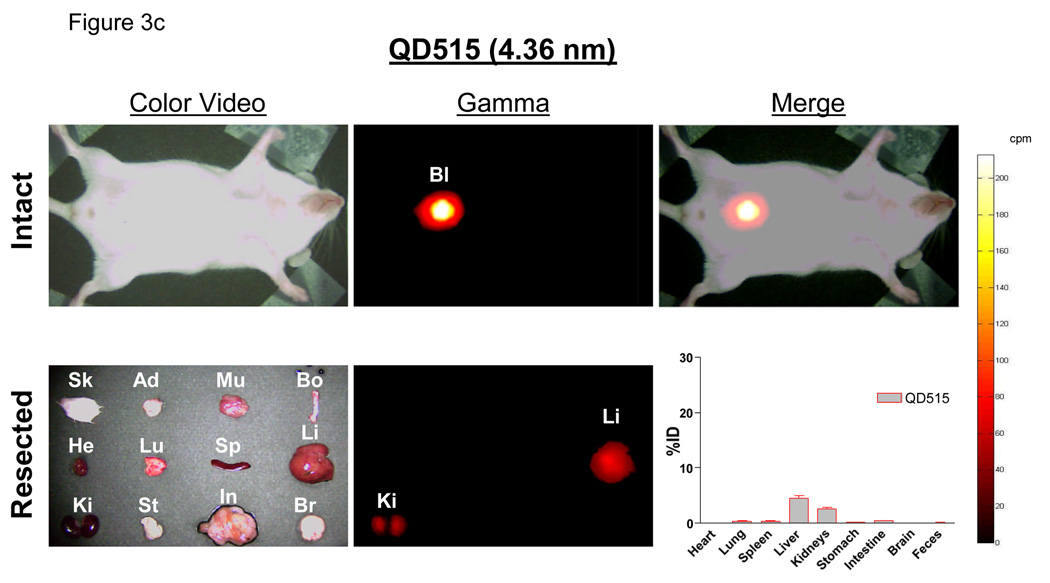
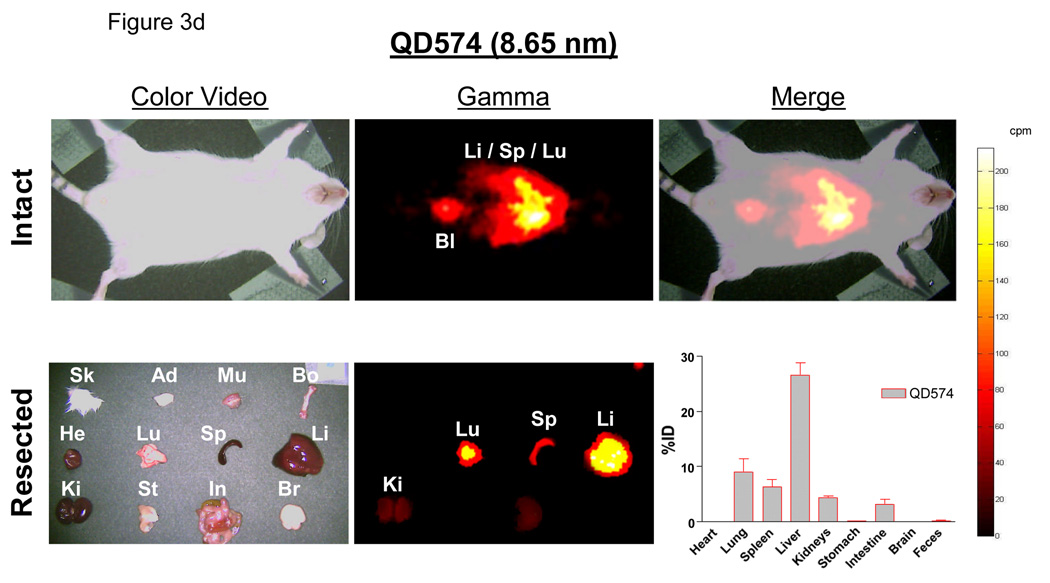
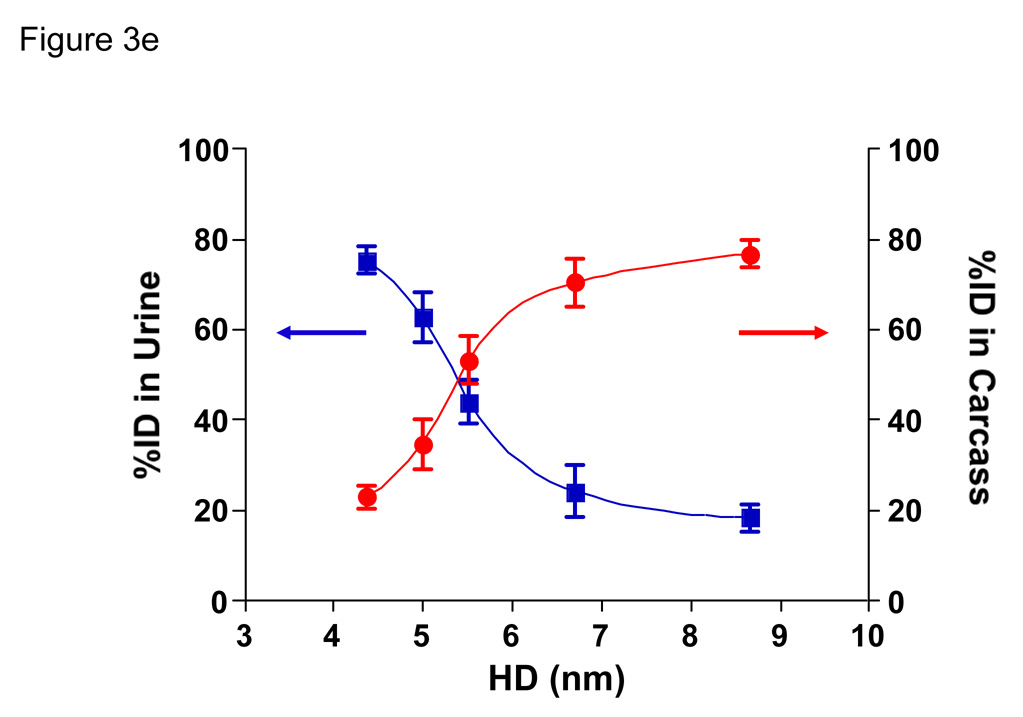
The field of nanotechnology holds great promise for the diagnosis and treatment of human disease. However, the size and charge of most nanoparticles preclude their efficient clearance from the body as intact nanoparticles. Without such clearance or their biodegradation into biologically benign components, toxicity is potentially amplified and radiological imaging is hindered. Using intravenously administered quantum dots in rodents as a model system, we have precisely defined the requirements for renal filtration and urinary excretion of inorganic, metal-containing nanoparticles. Zwitterionic or neutral organic coatings prevented adsorption of serum proteins, which otherwise increased hydrodynamic diameter by >15 nm and prevented renal excretion. A final hydrodynamic diameter <5.5 nm resulted in rapid and efficient urinary excretion and elimination of quantum dots from the body. This study provides a foundation for the design and development of biologically targeted nanoparticles for biomedical applications.


Figures

Fig. 1
Fig. 1. Design of fluorescent QDs, measurement of hydrodynamic diameter, and interaction of the organic coating with serum proteins
a. Chemical compositions of CdSe/ZnS QDs with DHLA (anionic), cysteamine (cationic), cysteine (zwitterionic), and DHLA-PEG (neutral) coatings. b. GFC (mobile phase = PBS, pH 7.4) of QDs (CdSe/ZnS core/shell, diameter 3.02 nm) with organic coatings shown in (a) after treatment with PBS, pH 7.4 (blue line) or FBS (red line). λexc = 414 nm. λem = 534 nm. Molecular weight markers M1 (thyroglobulin; 669 kDa, 18.0 nm HD), M2 (γ-globulin; 158 kDa, 11.9 nm HD), M3 (ovalbumin; 44 kDa, 6.13 nm HD), and M4 (myoglobin; 17 kDa, 3.83 nm HD) are shown by arrows. c. GFC (mobile phase = PBS, pH 7.4) of QD-Cys of various hydrodynamic diameters. λexc = 414 nm. λem = 554 nm. Molecular weight markers (arrows) are as described in (a). Also shown are the peak emission wavelengths as a function of core/shell diameter measured by TEM, DLS, and GFC. TEM size data for each sample was determined from the average of at least 150 measurements. DLS and GFC measurements (mean ± S.D.) were from N = 3 independent experiments. %PD = poly-dispersity. d. TEM pictures of QD515 (left, core/shell 2.85 nm) and QD574 (right, core/shell 4.31 nm). Scale bar = 20 nm.
Fig. 2
Fig. 2. In vivo fluorescence imaging of intravenously injected QD-Cys
a. Kidneys (Ki), ureters (Ur; arrowheads) and bladder (Bl) either T = 0 (top) or T = 2 hr (bottom) after intravenous injection of QD515 into the rat. Scale bar = 1 cm. b. Surgically exposed CD-1 mouse bladders after intravenous injection of QD515, QD534, QD554, QD564, or QD574 of defined HD. Shown are color video (top) and fluorescence images (bottom) for uninjected control bladder (Ctrl) and 4 hr post-injection (FL) for each QD. A 525 ± 25 nm emission filter was used for QD515 and QD534. A 560 ± 20 nm filter was used for QD554, QD564, and QD574. The exposure time (200 ms) and normalizations were the same for all fluorescence images. Scale bar = 1 cm.
Fig. 3
Fig. 3. Blood clearance, biodistribution, and total body clearance of nano-sized objects
a. Blood concentration (%ID/g) of 99mTc-labeled QDs after intravenous injection into CD-1 mice. Each data point is the mean ± S.D. from N = 5 animals. b. Blood half-life (mean ± 95% confidence intervals) as a function of HD calculated from the data in Fig. 3a. c. Radioscintigraphic images of 99mTc-QD515 (4.36 nm) 4 hr post-intravenous injection. Shown are the color video (left) and Anger camera gamma-ray images (middle) of the intact animal immediately after sacrifice (top row), and of organs after resection (bottom row). Also shown are the merge of the color video and gamma images (top right) and the quantitative distribution of 99mTc-QD515 in all organs after well counting (bottom right). Abbreviations used are: Sk, skin; Ad, adipose; Mu, muscle; Bo, bone; He, heart; Lu, lungs; Sp, spleen; Li, liver; Ki, kidneys; St, stomach; In, intestine; Br, brain; and Bl, bladder. Each point represents the mean ± S.D. of N = 5 animals. d. In vivo analysis of 99mTc-QD574 (8.65 nm) as described for Fig. 3c. e. Urine excretion (blue curve) and carcass retention (red curve) of 99mTc-QDs of various HDs 4 hr after intravenous injection into CD-1 mice. Each point represents the mean ± S.D. of N = 5 animals.

References

    1. Hardman R. A toxicologic review of quantum dots: toxicity depends on physicochemical and environmental factors. Environ Health Perspect. 2006;114:165–172. - PMC - PubMed
    1. Ballou B, et al. Sentinel lymph node imaging using quantum dots in mouse tumor models. Bioconjug Chem. 2007;18:389–396. - PubMed
    1. Uyeda HT, Medintz IL, Jaiswal JK, Simon SM, Mattoussi H. Synthesis of compact multidentate ligands to prepare stable hydrophilic quantum dot fluorophores. J Am Chem Soc. 2005;127:3870–3878. - PubMed
    1. Chapman AP, et al. Therapeutic antibody fragments with prolonged in vivo half-lives. Nat Biotechnol. 1999;17:780–783. - PubMed
    1. Goel A, et al. Genetically engineered tetravalent single-chain Fv of the pancarcinoma monoclonal antibody CC49: improved biodistribution and potential for therapeutic application. Cancer Res. 2000;60:6964–6971. - PubMed

Publication types