

Excitability constraints on voltage-gated sodium channels
- PMID: 17892320
- PMCID: PMC1988852
- DOI: 10.1371/journal.pcbi.0030177
Excitability constraints on voltage-gated sodium channels
Abstract
We study how functional constraints bound and shape evolution through an analysis of mammalian voltage-gated sodium channels. The primary function of sodium channels is to allow the propagation of action potentials. Since Hodgkin and Huxley, mathematical models have suggested that sodium channel properties need to be tightly constrained for an action potential to propagate. There are nine mammalian genes encoding voltage-gated sodium channels, many of which are more than approximately 90% identical by sequence. This sequence similarity presumably corresponds to similarity of function, consistent with the idea that these properties must be tightly constrained. However, the multiplicity of genes encoding sodium channels raises the question: why are there so many? We demonstrate that the simplest theoretical constraints bounding sodium channel diversity--the requirements of membrane excitability and the uniqueness of the resting potential--act directly on constraining sodium channel properties. We compare the predicted constraints with functional data on mammalian sodium channel properties collected from the literature, including 172 different sets of measurements from 40 publications, wild-type and mutant, under a variety of conditions. The data from all channel types, including mutants, obeys the excitability constraint; on the other hand, channels expressed in muscle tend to obey the constraint of a unique resting potential, while channels expressed in neuronal tissue do not. The excitability properties alone distinguish the nine sodium channels into four different groups that are consistent with phylogenetic analysis. Our calculations suggest interpretations for the functional differences between these groups.
Conflict of interest statement
Figures
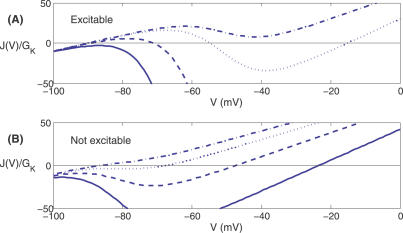
 )=(−50 mV, 6 mV), and the dot-dashed, dotted, dashed, and solid lines correspond to Θ = 0.5, 1, 5, 20. For Θ = 1, 5, there are multiple fixed points (i.e., zero crossings), and hence this channel is excitable. (B) The sodium channel is characterized by (
 )=(−80 mV, 6 mV), and the dot-dashed, dotted, dashed, and solid lines correspond to Θ = 0.1, 0.2, 0.4, 0.8. There is a single fixed point for each, and hence for this channel excitability is impossible.
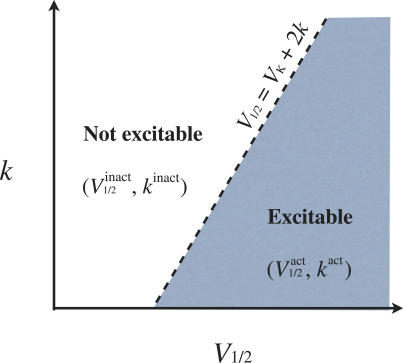
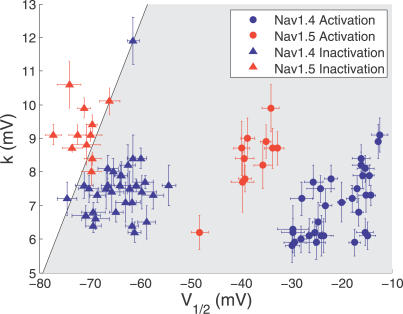
 and inactivation
  curve parameters are predicted to lie on opposite sides of the excitability threshold given by the line V
1/2 = V
K + 2k.
curve parameters are predicted to lie on opposite sides of the excitability threshold given by the line V
1/2 = V
K + 2k.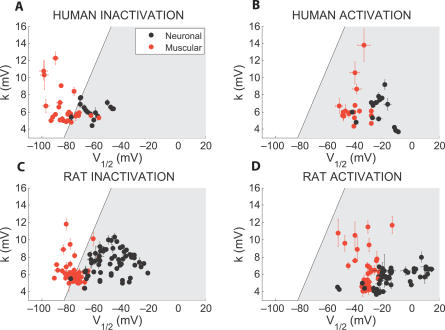
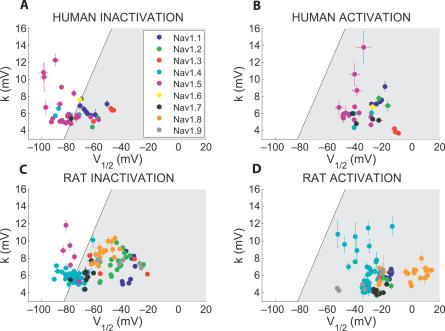
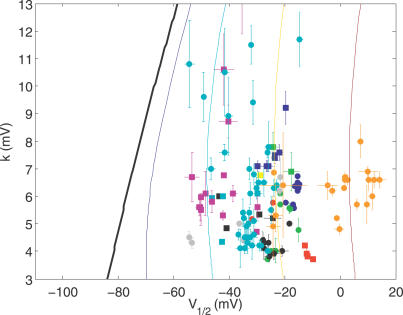
 . This plot contains all data for which we have measurements of both inactivation and activation properties, including wild-type, mutant, and different conditions for human, rat, and mouse.
References
-
- Jacob F. Evolution and tinkering. Science. 1977;196:1161–1166. - PubMed
-
- Kirschner MW, Gerhart JC. The plausibility of life: Resolving Darwin's dilemma. New Haven: Yale University Press; 2005.
-
- Dekel E, Alon U. Optimality and evolutionary tuning of the expression level of a protein. Nature. 2005;436:588–922. - PubMed
-
- Hille B. Ion channels of excitable membranes. Sunderland (Massachusetts): Sinauer; 2001.
Publication types
MeSH terms
Substances
LinkOut - more resources
Full Text Sources
