Comparative Study
. 2007 Sep;3(9):1709-23.
doi: 10.1371/journal.pgen.0030157. Epub 2007 Jul 31.

Comparing the DNA hypermethylome with gene mutations in human colorectal cancer

Affiliations
Comparative Study

Comparing the DNA hypermethylome with gene mutations in human colorectal cancer

Kornel E Schuebel et al. PLoS Genet. 2007 Sep.

Abstract

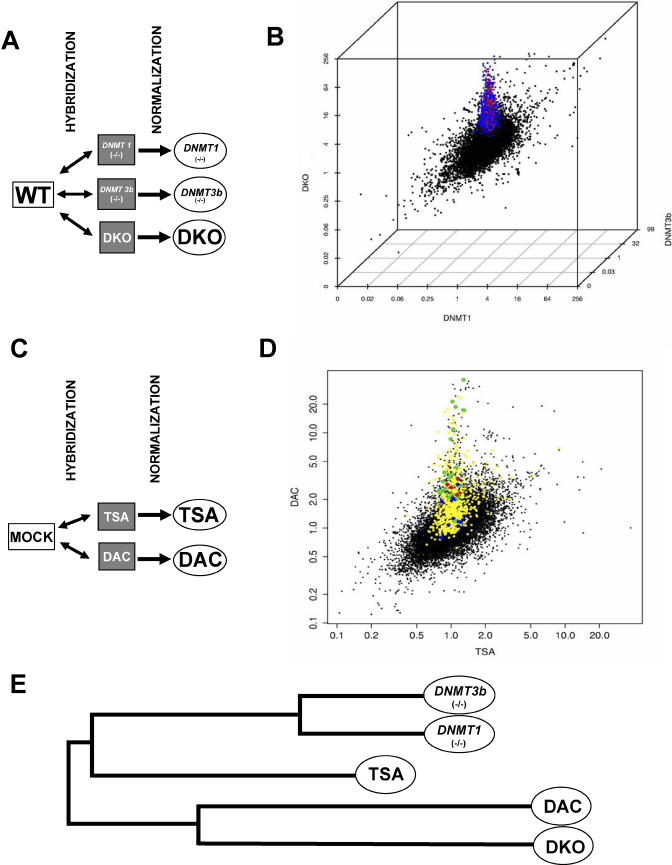
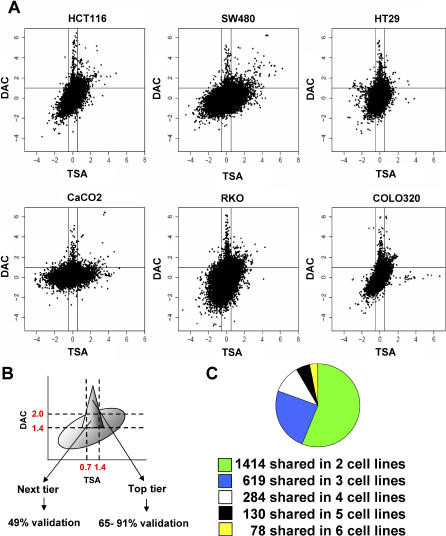
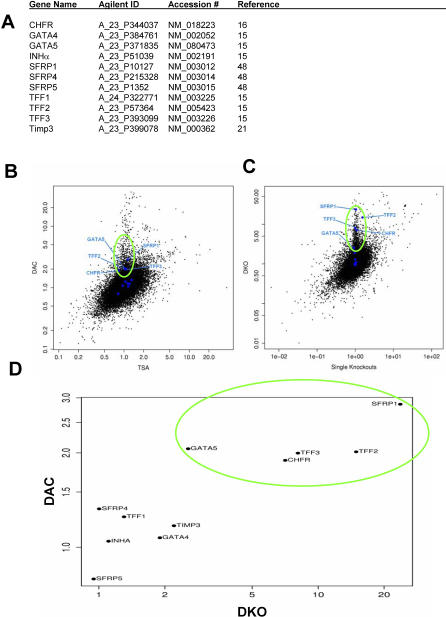
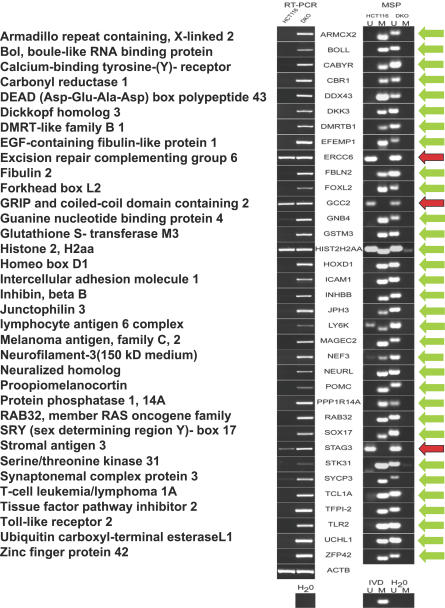
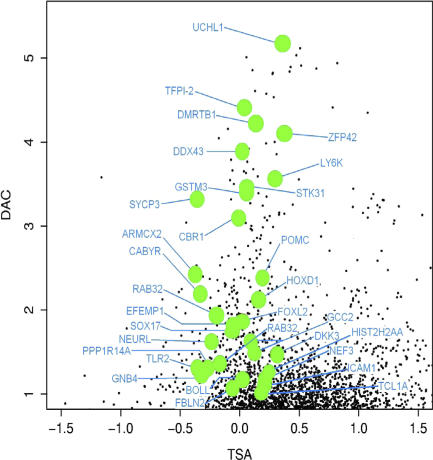
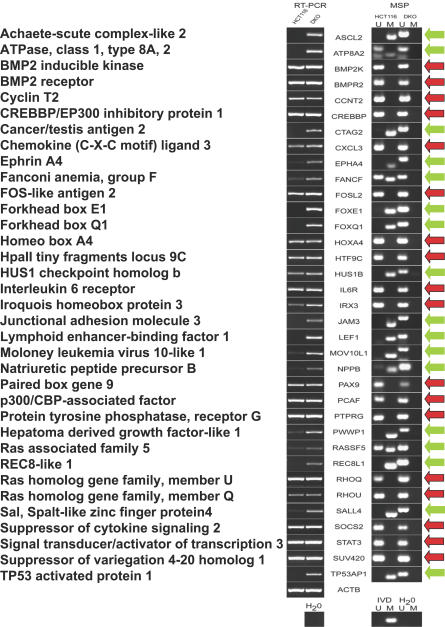
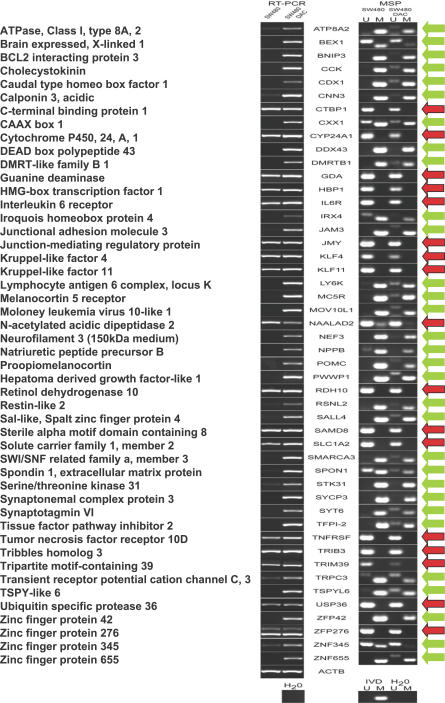
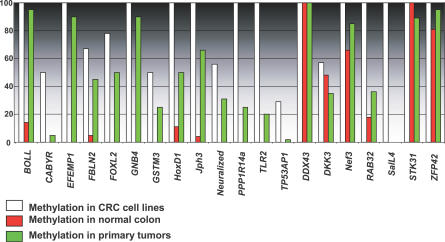
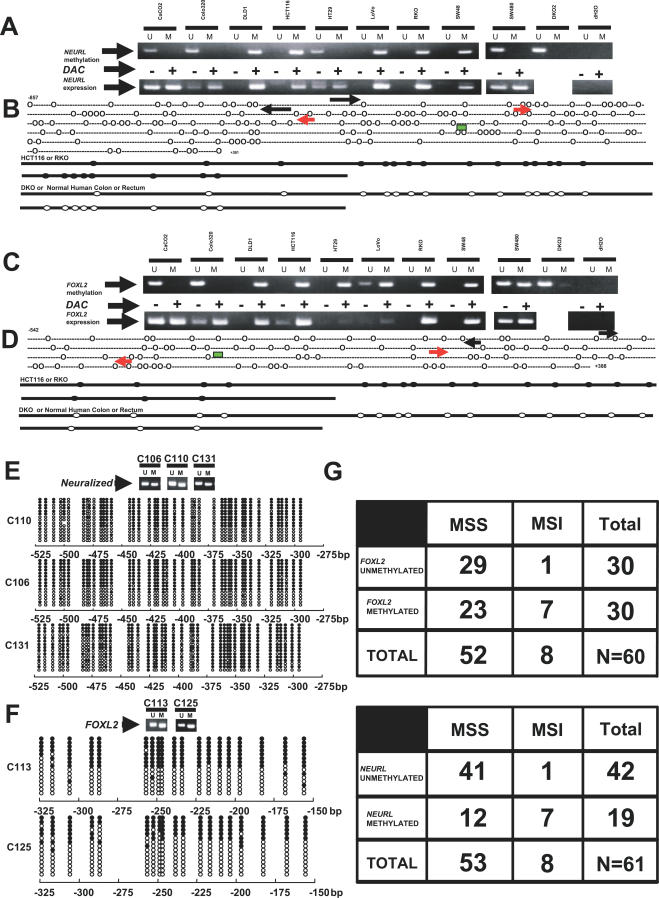
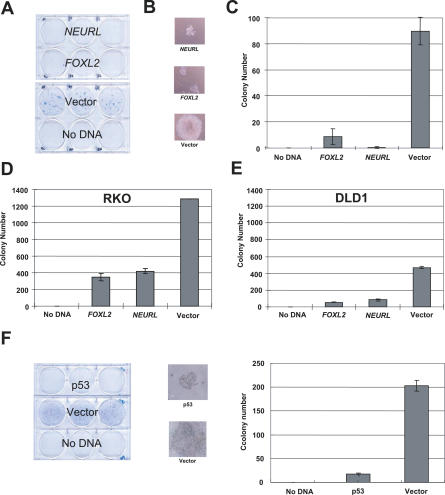
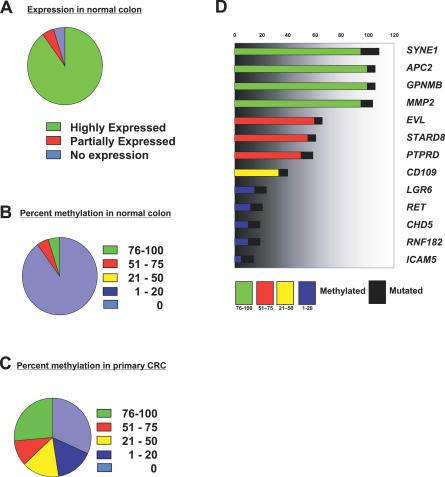
We have developed a transcriptome-wide approach to identify genes affected by promoter CpG island DNA hypermethylation and transcriptional silencing in colorectal cancer. By screening cell lines and validating tumor-specific hypermethylation in a panel of primary human colorectal cancer samples, we estimate that nearly 5% or more of all known genes may be promoter methylated in an individual tumor. When directly compared to gene mutations, we find larger numbers of genes hypermethylated in individual tumors, and a higher frequency of hypermethylation within individual genes harboring either genetic or epigenetic changes. Thus, to enumerate the full spectrum of alterations in the human cancer genome, and to facilitate the most efficacious grouping of tumors to identify cancer biomarkers and tailor therapeutic approaches, both genetic and epigenetic screens should be undertaken.


Conflict of interest statement

Competing interests. The commercial rights to the MSP technique belong to Oncomethylome Sciences. SBB and JGH serve as consultants to Oncomethylome Sciences and are entitled to royalties from any commercial use of this procedure.

Figures

Figure 1
Figure 1. Approach for Identification of the Human Cancer Cell Hypermethylome in HCT116 CRC Cells
(A) RNA from the indicated cell lines was isolated, labeled, hybridized, scanned, and fluorescent spot intensities normalized by background subtraction and Loess transformation using Agilent Technologies 44K human microarrays. Parental wild-type HCT116 cells (WT) and isogenic knockout counterparts for DNA methyltransferase 1 (DNMT1−/−) or 3b (DNMT3B−/−) are compared in our study. DKO cells are doubly deficient for both DNMT1 and DNMT3B. (B) Gene-expression changes in HCT116 cells with genetic disruption of various DNA methyltransferases. A 3-D scatter plot indicating the gene-expression levels in HCT 116 cells with genetic disruption of DNMT1 (x-axis), DNMT3B (z-axis), and both DNMT1 and DNMT3B (DKO; y-axis) in fold scale. Individual gene-expression changes are in black with the average for three experiments (red spots) or from an individual experiment (blue spots) for those genes in DKO cells with greater than 4-fold expression change. (C) HCT116 cells were treated with 300 nM TSA for 18 h or 5 μM DAC for 96 h and processed as described above. (D) Gene-expression changes for HCT116 cells treated with TSA (x-axis) or DAC (y-axis) are plotted by fold change. Yellow spots indicate genes from DKO cells with 2-fold changes and above. Notice the loss of sensitivity when compared to gene-expression increases seen in DKO cells (80% of genes greater than 4-fold in the DKO cells now becomes greater than 1.3-fold in DAC-treated cells). Green spots indicate randomly selected genes verified to have complete promoter methylation in wild-type cells, reexpression in DKO cells and after DAC treatment, while red spots indicate selected genes that were identified as false positives (See Figures 4, 6, and 7 for validation results). Blue spots indicate the location of the 11 guide genes—previously shown to be hypermethylated and completely silenced in HCT 116 cells—used in this study (see Figure 3 for description). A distinct group of genes, including five of 11 guide genes, displays increases of greater than 2-fold after DAC treatment but no increase after TSA treatment. These genes form the top tier of candidate hypermethylated genes as discussed in the text. (E) Relatedness of whole-transcriptome expression patterns identified by dendrogram analysis. Individual single genetic disruption of DNMT1 and DNMT3B, DKO and DAC treatment, and TSA treatment each form three distinct categories of gene expression changes.
Figure 2
Figure 2. Characterization of the Human Cancer Cell Hypermethylome in Different Human CRC Cell Lines
(A) Gene-expression changes for the indicated cells treated with TSA (x-axis) or DAC (y-axis) are plotted by log-fold change, and individual genes are shown in black. (B) Validation of the DNA hypermethylome. The characteristic spike of hypermethylated genes defined by treatment of cells with DAC or TSA consists of two tiers, with distinct features. The top tier of genes was identified as a zone in which gene expression did not increase with TSA (<1.4 fold) and displayed no detectable expression in wild-type cells, but increased greater than 2-fold with DAC treatment. The next tier of genes was identified as a cluster of genes for which expression changes of TSA and wild type were identical to those in the top tier, but increased between 1.4-fold and 2-fold with DAC treatment. Gene expression validation by RT-PCR and MSP indicated a validation frequency of 91% for top-tier genes in HCT116 cells, including genes that increased in DKO cells by greater than 2-fold. Next-tier genes in HCT116 cells were confirmed at a frequency of 49%, and in the SW480 top tier, with a frequency of 65%. (C) Shared candidate hypermethylated genes in CRC cell lines. We identified a total of 5,906 unique genes in all six cell lines with expression changes falling within the criteria of top- or next-tier categories. Overlaps in gene expression changes among two, three, four, five, or six cell lines are indicated; these range from 1,414 genes shared among two cell lines to 78 genes that were shared among all six cell lines.
Figure 3
Figure 3. Guide Genes Used in This Study
(A) Gene names, Agilent Technologies probe name, Genbank accession number, and references for the 11 guide genes previously shown to be hypermethylated and completely silenced in HCT116 cells. (B, C) Blue spots and gene names indicate the location of the 11 guide genes in a plot of TSA (x-axis) versus DAC (y-axis) gene expression changes on a log scale (B) or fold-change (C) scale. Five of 11 guide genes, circled in green, display increases of greater than 2-fold after DAC treatment but no increase after TSA treatment and these same genes have greater than 3-fold increases in DKO cells (green circle) (D) Direct comparison of guide genes in DKO and DAC plots. A distinct group of five guide genes, indicated by a green circle, showing greater than 3-fold expression changes in DKO cells and greater than 2-fold in DAC-treated cells, define the upper tier of candidate hypermethylated genes as discussed in the text. Another three genes increased 1.3-fold, and three failed to increase with DAC treatment, allowing criteria for the next tier of gene expression to be established as described in the text.
Figure 4
Figure 4. Verification of the HCT116 Top Tier Hypermethylome
List of HCT116 candidate hypermethylated genes selected for verification of expression (by RT-PCR of HCT116 and DKO cells) and promoter methylation (by MSP of HCT116 and DKO cells) status. Gene descriptions are indicated on the left side of the panel and gene names are shown next to the PCR results. Water (RT-PCR and MSP), in vitro methylated DNA (for MSP), and actin beta (ACTB) were used as controls for each individual gene; a representative sample is shown. Green arrows identify genes that verified the array results, red arrows those that did not.
Figure 5
Figure 5. Distribution of Verified HCT116 Top-Tier genes
Green spots show the location of individual genes with names indicated in blue. The top tier of gene-expression changes within the spike shown in Figure 1D has been magnified, and values for DAC and TSA expression changes are shown in log scale.
Figure 6
Figure 6. Verification of the HCT116 Next Tier Hypermethylome
Genes were selected for verification of expression (by RT-PCR of HCT116 and DKO cells) and promoter methylation (by MSP of HCT116 and DKO cells) status. Gene names are indicated on the left side of the panel and gene abbreviations are shown next to the PCR results. Water (RT-PCR and MSP), in vitro methylated DNA (for MSP), and actin beta (ACTB) were used as controls for each individual gene; a representative sample is shown. Green arrows identify genes that verified the array results, red arrows those that did not as discussed in the text.
Figure 7
Figure 7. Verification of the SW480 Top-Tier Hypermethylome
Genes were selected for verification of expression (by RT-PCR of SW480 and DAC-treated SW480 cells) and promoter methylation (by RT-PCR of SW480 and DAC-treated SW480 cells) status. Full gene names are indicated on the left side of the panel and abbreviated gene names are shown next to the PCR results. Water (RT-PCR), in vitro methylated DNA (for MSP), and actin beta (ACTB) were used as controls for each individual gene; a representative sample is shown. Green arrows identify genes that verified the array results, red arrows those that did not as discussed in the text.
Figure 8
Figure 8. Comparison of Hypermethylation Frequencies in Human Tumor Samples
Methylation analysis of verified hypermethylome genes in human tissue samples. Twenty genes from the verified gene lists were randomly selected from the HCT116 top tier (BOLL, DDX43, DKK3, FOXL2, HOXD1, JPH3, NEF3, NEURL, PPP1R14A, RAB32, STK31, and TLR2), HCT116 next tier (SALL4 and TP53AP1), or SW480 top tier (ZFP42) and analyzed for methylation in CRC cell lines (white columns), normal colon (red columns), or primary tumors (green columns). Percentage of methylation is indicated on the y-axis, and the abbreviated gene name on the x-axis. We tested at least six different cell lines, 16 to 40 colonic samples from noncancer patients, and between 18 and 61 primary CRC samples for each gene.
Figure 9
Figure 9. Epigenetic Inactivation of NEURL and FOXL2 Genes in Colorectal Cancer Cell Lines and Tumors
(A–D) Methylation and expression analyses. Cell line abbreviations are indicated at the top (A, C), with the upper panel indicating methylation tested by MSP and expression tested by RT-PCR before (−) and after (+) DAC treatment. U indicates unmethylated and M indicates methylated alleles DKO and water (H2O) controls are indicated on the right panel. Graphical display of the NEURL (B) or FOXL2 (D) promoter CpG islands, with bisulfite sequencing primers indicated in black, MSP primers indicated in red, and CpG nucleotides as open circles. Transcription start sites are indicated with a green square, and the 5′ and 3′ ends are indicated by numbers with respect to the transcription start site. Bisulfite sequencing results (lower panels) in cell lines (HCT116, RKO, or DKO) or human tissues (normal colon or rectum); unmethylated CpGs are indicated by open circles, methylated CpGs by shaded circles. (E) Methylation analysis of the NEURL CpG island in human tumors. Upper panel shows results of primary CRC samples analyzed by MSP. Positive samples analyzed further by bisulfite sequencing are denoted with an arrow. Lower panel shows bisulfite sequencing results for 15 cloned alleles of each tumor sample, with the location relative to the transcription start site indicated in bp. Open circles indicate unmethylated CpG dinucleotides and closed circles indicate methylated dinucleotides. (F) Methylation analysis of the FOXL2 CpG island in human tumors. Upper panel shows results of primary CRC samples analyzed by MSP. Positive samples analyzed by bisulfite sequencing are denoted with an arrow. Lower panel shows bisulfite sequencing results for 15 cloned alleles of each tumor sample, with the location relative to the transcription start site indicated in bp. Open circles indicate unmethylated CpG dinucleotides and closed circles indicate methylated dinucleotides. (G) Results of MSP methylation status of FOXL2 and NEURL in colon cancers classified as being microsatellite stable (MSS) or having microsatellite instability (MSI) by classic criteria.
Figure 10
Figure 10. Tumor-Suppressor Activity of FOXL2 and NEURL Gene Products In Vitro
(A) Expression vectors encoding full length NEURL or FOXL2, or empty vector, were transfected into HCT116 cells, selected for hygromycin resistance, and stained. (B) Resulting colonies were visualized by light microscopy. (C–E) Colony number resulting from transfection with the indicated plasmid in HCT116 cells (C), RKO (D), or DLD1 cells (E). (F) Growth suppression of HCT116 cells by p53. Colony formation (left panel), colony visualization (middle panel), and quantitation (right panel) are indicated.
Figure 11
Figure 11. Comparing Methylation and Mutation Frequency of Cancer Genes in CRC Tumor Samples
(A) Expression of matched CAN genes in normal human colon measured by RT-PCR. Partially expressed and no expression indicated weak or absent RT-PCR amplification. (B, C) Methylation analysis of CAN genes. Fifty-six CAN genes were located in the top or next tier of one microarray in one or more cell lines. Of these, 45 genes contained CpG islands. Selected genes from this list with methylation in cell lines (26 genes) were analyzed for methylation in normal colon (B) and primary CRC (C). Frequency of methylation of these genes is shown as a percentage. (D) Relationship between methylation status, analyzed by MSP, and mutation for 13 genes overlapping the CAN and hypermethylome gene lists.

References

    1. Ponder BA. Cancer genetics. Nature. 2001;411:336–341. - PubMed
    1. Herman JG, Baylin SB. Gene silencing in cancer in association with promoter hypermethylation. N Engl J Med. 2003;349:2042–2054. - PubMed
    1. Sjoblom T, Jones S, Wood LD, Parsons DW, Lin J, et al. The consensus coding sequences of human breast and colorectal cancers. Science. 2006;314:268–274. - PubMed
    1. Antequera F, Bird A. Number of cpg islands and genes in human and mouse. Proc Natl Acad Sci U S A. 1993;90:11995–11999. - PMC - PubMed
    1. Costello JF, Fruhwald MC, Smiraglia DJ, Rush LJ, Robertson GP, et al. Aberrant CpG-island methylation has non-random and tumour-type-specific patterns. NatGenet. 2000;24:132–138. - PubMed

Publication types