Review
. 2007 Nov;62(2):142-60.
doi: 10.1111/j.1574-6941.2007.00375.x. Epub 2007 Sep 20.

Multivariate analyses in microbial ecology

Affiliations
Review

Multivariate analyses in microbial ecology

Alban Ramette. FEMS Microbiol Ecol. 2007 Nov.

Abstract

Environmental microbiology is undergoing a dramatic revolution due to the increasing accumulation of biological information and contextual environmental parameters. This will not only enable a better identification of diversity patterns, but will also shed more light on the associated environmental conditions, spatial locations, and seasonal fluctuations, which could explain such patterns. Complex ecological questions may now be addressed using multivariate statistical analyses, which represent a vast potential of techniques that are still underexploited. Here, well-established exploratory and hypothesis-driven approaches are reviewed, so as to foster their addition to the microbial ecologist toolbox. Because such tools aim at reducing data set complexity, at identifying major patterns and putative causal factors, they will certainly find many applications in microbial ecology.


Figures
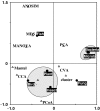
Fig. 1
Fig. 1
Correspondence analysis of method usage in various scientific fields. In this symmetrical scaling of CA scores, the first two axes explained 47.3% and 35.8% of the total inertia of Table 1, respectively. The gray areas were drawn to facilitate the interpretation. Complete row names (scientific fields; full circles) and column names (methods; white triangles) are given in Table 1. Methods (triangles) located close to each other correspond to methods often occurring together in studies. The distance between a scientific field point and a method point approximates the probability of method usage in the field.
Fig. 2
Fig. 2
Ordination diagrams in two dimensions. (a) In a PCA biplot representation, samples are represented by dots and species by arrows. The arrows point in the direction of maximal variation in the species abundances, and their lengths are proportional to their maximal rate of change. Long arrows correspond to species contributing more to the data set variation. Right-angle projection of a sample dot on a species arrow gives approximate species abundance in the sample. (b) In a CA joint plot representation focusing on species distance, both samples and species are depicted as dots. Species dots correspond to the center of gravity (inertia) of the samples where they mostly occur. Distances between sample and species points give an indication of the probability of species composition in samples (see Table 2 for more details about diagram interpretation).
Fig. 3
Fig. 3
Partitioning biological variation into the effects of two factors. The large rectangle represents the total variation in the biological data table, which is partitioned among two sets of explanatory variables (a, b). Fraction 4 shows the unexplained part of the biological variation. Fractions 1 and 3 are obtained by partial constrained ordination or partial regression, and can be tested for significance. For instance, fraction 1 corresponds to the amount of biological variation that can be exclusively explained by (a) effects when (b) effects are taken into consideration (i.e., when b is considered as a covariable). Fraction 2 [i.e., variation indifferently attributed to (a) and (b) or a covariation of (a) and (b)] is obtained by subtracting fractions 1 and 3 from the total explained variance, and cannot be tested for statistical significance.
Fig. 4
Fig. 4
Relationships between numerical methods. Exploratory tools such as PCA, CA, PCoA, NMDS, or cluster analysis can be applied to a sample-by-species table to extract the main patterns of variation, to identify groups or clusters of samples, or specific species interactions. Sample scores on the main axes of variation can be related to variation in environmental variables using indirect gradient analyses. When a constrained analysis is desired (i.e. direct gradient analysis), RDA, db-RDA, CCA, or linear discriminant analysis can be used as extensions of the unconstrained methods. Mantel tests are appropriate to test the significance of the correlation between two distance matrices (e.g. one based on species data and the other on environmental variables). Raw data may be transformed, normalised or standardised as appropriate before analysis.
Fig. 5
Fig. 5
Combination of ordination and cluster analysis. On a same distance matrix, NMDS or PCOA can be applied to represent the major axes of variation among objects in a two-dimensional space. The superimposition of the results of cluster analysis (primary connections) onto the ordination diagram can help identify the structure in the data set as discontinuities (clusters) into a continuous space (ordination). Adapted from Legendre & Legendre (1998).

References

    1. Acinas SG, Klepac-Ceraj V, Hunt DE, Pharino C, Ceraj I, Distel DL, Polz MF. Fine-scale phylogenetic architecture of a complex bacterial community. Nature. 2004;430:551–554. - PubMed
    1. Anderson MJ. A new method for non-parametric multivariate analysis of variance. Aust Ecol. 2001;26:32–46.
    1. Avise JC. Evolutionary Pathways in Nature: A Phylogenetic Approach. Cambridge, UK: Cambridge University Press; 2006. p. 298pp.
    1. Bisson IA, Marra PP, Burtt EH, Sikaroodi M, Gillevet PM. A molecular comparison of plumage and soil bacteria across biogeographic, ecological, and taxonomic scales. Microb Ecol. 2007;54:65–81. - PubMed
    1. Borcard D, Legendre P, Drapeau P. Partialling out the spatial component of ecological variation. Ecology. 1992;73:1045–1055.

Publication types