. 2007 Oct;26(7):2005-24.
doi: 10.1111/j.1460-9568.2007.05825.x. Epub 2007 Sep 24.

Relationship between the corticostriatal terminals from areas 9 and 46, and those from area 8A, dorsal and rostral premotor cortex and area 24c: an anatomical substrate for cognition to action

Affiliations

Relationship between the corticostriatal terminals from areas 9 and 46, and those from area 8A, dorsal and rostral premotor cortex and area 24c: an anatomical substrate for cognition to action

Roberta Calzavara et al. Eur J Neurosci. 2007 Oct.

Abstract

Our previous data indicate that there are specific features of the corticostriatal pathways from the prefrontal cortex. First, corticostriatal pathways are composed of focal, circumscribed projections and of diffuse, widespread projections. Second, there is some convergence between terminal fields from different functional regions of the prefrontal cortex. Third, anterior cingulate projections from area 24b occupy a large region of the rostral striatum. The goal of this study was to determine whether these features are also common to the corticostriatal projections from area 8A (including the frontal eye field; FEF), the supplementary eye field (SEF), dorsal and rostral premotor cortex (PMdr) and area 24c. Using a new approach of three-dimensional reconstruction of the corticostriatal pathways, along with dual cortical tracer injections, we mapped the corticostriatal terminal fields from areas 9 and 46, 8A-FEF, SEF, PMdr and 24b and c. In addition, we placed injections of retrogradely transported tracers into key striatal regions. The results demonstrated that: (i) a diffuse projection system is a common feature of the corticostriatal projections from different frontal regions; (ii) key striatal regions receive convergent projections from areas 9 and 46 and from areas 8A-FEF, SEF, PMdr and 24c, suggesting a potential pivotal role of these striatal regions in integrating cortical information; (iii) projections from area 24c, like those from area 24b, terminate widely throughout the striatum, interfacing with terminals from several frontal areas. These features of the corticostriatal frontal pathways suggest a potential integrative striatal network for learning.


Figures
F<sc>ig</sc>. 7
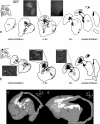
Fig. 7
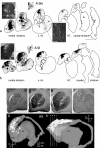
Projections from the SEF to the striatum. (a and b) Schematic chartings and microphotographs of the terminals following two injections into the SEF: (a) case 96, tritiated AA; (b) case 184, FR. The focal projection fields (black solid areas) and the diffuse projection fields are shown in charts at different AP levels: rostral striatum, AP 28–26; n. Ac, AP 22; AC, AP 18.5; and caudal striatum, AP 14–10. The diffuse terminal field for the tritiated AA injection (a, case 96) is shown as a shaded area in grey surrounding the focal projections. Microphotographs at low and high magnifications illustrate the focal and diffuse terminal fields. (c and d) 3-D rendering of the focal collective projections from the SEF shown in (c) coronal and (d) lateral views of the striatum. Scale bars, 5 mm (a and b schematics); microphotographs: 1 mm (lowest power); 200 µm (a) and 100 µm (b), (intermediate power); and 25 µm (highest power).
F<sc>ig</sc>. 1
Fig. 1
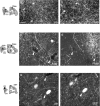
Microphotographs at low and high magnifications of the corticostriatal projections following tracer injections into (a and b) PMdr (case 161, FR) and (c–e) area 24c (case 62, tritiated AA). In (a) and (c), the charted outlines of the focal projections have been superimposed on the microphotographs. In (b) and (d), regions around the borders of the focal projections are shown at higher magnification. In (e), a region around the border of the diffuse projection vs. background (case 62, tritiated AA injection) is shown at higher magnification. Scale bars, 1 mm (a and c), 100 µm (b, d and e).
F<sc>ig</sc>. 2
Fig. 2
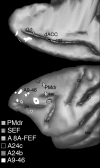
Three-dimensional reconstruction of the medial and lateral views of the brain, depicting the injection sites. Note: two adjacent injection sites in area 9 are represented as one large injection site, and two adjacent injection sites in SEF also appear as one large injection site. White, areas 9 and 46 (A9–46; the asterisks indicate injections in area 46); grey with black border, area 24b; black with white border, area 24c; black and white horizontal stripes, area 8A-FEF; black and white horizontal and vertical stripes, SEF; black and white vertical stripes, PMdr. Note that injection sites collectively cover a limited portion of each functional region. Abbreviations in this and subsequent Figs are in the main list.
F<sc>ig</sc> 4
Fig 4
Projections from area 46 to the striatum. (a and b) Schematic chartings and microphotographs of the terminals following injections into the (b) rostral (case 98) and (b) caudal (case 131) area 46. The focal projection fields (black solid areas) and the diffuse projection fields are shown in charts at different AP levels: rostral striatum (AP 28–26), n. Ac (AP 22), AC (AP 18.5) and caudal striatum (AP 14–10). The diffuse terminal field for the tritiated AA injection (a, case 98) is shown as shaded areas in grey surrounding the focal projections. Microphotographs at low and high magnification illustrate the focal and diffuse terminal fields. (c–f) Coronal slices through the 3-D model with the corresponding Nissl section. Focal projections from rostral and caudal area 46 are indicated with dotted and continuous lines, respectively. (e) Summary section illustrating the topographic organization of the focal projections from different parts of areas 9 and 46 (white dotted line, medial area 9; white continuous line, lateral area 9; black dotted line, rostral area 46; black continuous line, caudal area 46). (g and h) 3-D rendering of the focal collective projections from area 46 shown in (g) coronal and (h) lateral views of the striatum. White lines in (h) indicate the levels of sections illustrated in (c) – (f) Scale bars, 5 mm (a and b), 1 mm and 100 µm (low- and high-power photomicrographs, respectively).
F<sc>ig</sc>. 3
Fig. 3
Projections from area 9 to the striatum. (a and b) Schematic chartings and microphotographs of the terminals following injections into the medial (a, case 78) and lateral (b, case 121) area 9. The focal projection fields (black solid areas) and the diffuse projection fields are shown in charts at different AP levels: rostral striatum, AP 28–26; n. Ac, AP 22; anterior commissure (AC; AP 18.5) and caudal striatum (AP 14–10). Cd, caudate n.; ic, internal capsule; Pu, putamen. Microphotographs at low and high magnifications illustrate the focal and diffuse terminal fields. (c–f) Coronal slices through the 3-D model with the corresponding Nissl section. Focal projections from medial and lateral area 9 are indicated with dotted and continuous lines, respectively. (g and h) 3-D rendering of the focal collective projections from area 9 shown in (g) coronal and (h) lateral views of the striatum. White lines in (h) indicate the level of sections illustrated in (c) – (f) Scale bars, 5 mm (a and b), 1 mm and 50 µm (low- and high-power photomicrographs, respectively).
F<sc>ig</sc>. 5
Fig. 5
Corticostriatal projections following a small PHA-L injection into area 9 (case 133) are illustrated in a chart of the striatum at the n. Ac level. Microphotograph at high magnification illustrates an isolated labelled fibre in the lateral Cd n. Note that the pattern of focal vs. diffuse projections is also distinguishable following a confined injection site. Scale bar, 5 mm; microphotograph, 50 µm.
F<sc>ig</sc>. 6
Fig. 6
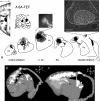
Projection from area 8A-FEF to the striatum. (a) Schematic chartings and microphotographs of the terminals following an injection into area 8A-FEF (case 478). The injection site in area 8A-FEF is illustrated through coronal brain sections and the relative 3-D reconstruction of the prearcuate region. The focal projection fields (black solid areas) and the diffuse projection fields are shown in charts at different AP levels: rostral striatum, AP 28–26; n. Ac, AP 22; AC, AP 18.5; and caudal striatum, AP 14–10. The diffuse terminal field for this tritiated AA injection is shown as a shaded area in grey surrounding the focal projections. illustrate the focal and diffuse terminal fields. b and c: 3-D rendering of the focal collective projections from the area 8A-FEF shown in coronal (b) and lateral (c) views of the striatum.Scale bars in (a), 5 mm (schematics); 1 mm and 200 µm (microphotographs at low and high magnifications, respectively).
F<sc>ig</sc>. 8
Fig. 8
Projections from PMdr to the striatum. (a and b) Schematic chartings and microphotographs of the terminals following injections into PMdr (a, case 161; b, case 166). The focal projection fields (black solid areas) and the diffuse projection fields are shown in charts at different AP levels: rostral striatum, AP 28–26; n. Ac, AP 22; AC, AP 18.5; and caudal striatum, AP 14–10. Microphotographs at low and high magnifications illustrate the focal and diffuse terminal fields. (c and d) Microphotographs at high magnification illustrate axons with terminals representing some of the diffuse projections (case 102) extending in (c) the dorsomedial Cd n. and in (d) the putamen. (e and f) 3-D rendering of the focal collective projections from PMdr shown in (e) coronal and (f) lateral views of the striatum. Scale bars, 5 mm (schematics in a and b), 1 mm and 50 µm (low- and high-power, respectively, microphotographs in a and b); 100 µm (microphotographs in c and d).
F<sc>ig</sc>. 9
Fig. 9
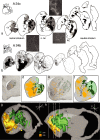
Projections from the dACC areas to the striatum. (a and b) Schematic chartings and microphotographs of the terminals following injections into area 24c (a, case 62) and area 24b (b, case 36). The focal projection fields (black solid areas) and the diffuse projection fields are shown in charts at different AP levels: rostral striatum, AP 28–26; n. Ac, AP 22; AC, AP 18.5; and caudal striatum, AP 14–10. The diffuse terminal field for the tritiated AA injection (a, case 62) is shown as a shaded area in grey surrounding the focal projections. Microphotographs at low and high magnification illustrate the focal and diffuse terminal fields. c - f: coronal slices through the 3-D model with the corresponding Nissl section. In d -f, the maps of the diffuse terminal fields from areas 24c and 24b are superimposed on the collective focal projections from these areas. Dark green, area 24c; orange, area 24b. g-h: 3-D rendering of the focal collective projections from the dorsal anterior cingulate areas shown in coronal (g) and lateral (h) views of the striatum. White lines in h indicate the level of sections illustrated in c-f. Scale bars, 5 mm (schematics in a and b), 1 mm and 50 µm (low- and high-power, respectively, microphotograph in a), 100 µm (microphotograph in b).
F<sc>ig</sc>. 10
Fig. 10
3-D rendering of the combined focal projections from all the frontal regions, illustrating the overlap between corticostriatal projections. The white lines in (a) the lateral view of the striatum indicate the level of sections illustrated in (b) and (c) (b and c) Coronal slices through the 3-D model with the corresponding Nissl section at the AP levels corresponding to (b) the rostral striatum (AP 26) and to (c) the n. Ac (AP 22). Note that the striatal sections shown in (b) and (c) have different magnifications. Black arrows indicate key striatal regions receiving convergent projections from areas 9 and 46, 8A-FEF, SEF, PMdr and 24c. Yellow dotted line, areas 9 and rostral 46; dark yellow, caudal area 46; white, area 8A-FEF; green, SEF; blue-green dotted line, PMdr; grey, 24c. Scale bars, 2 mm.
F<sc>ig</sc>. 11
Fig. 11
3-D rendering of the combined focal projections from all the frontal regions, illustrating the overlap between corticostriatal projections. The white lines in (a) the lateral view of the striatum indicate the level of sections illustrated in (b) and (d) (b and d) Coronal slices through the 3-D model with the corresponding Nissl section at the AP level corresponding to (b) the AC (AP 18.5) and to (d) the caudal striatum (AP 10). Black arrows indicate key striatal regions receiving convergent projections from areas 9 and 46, 8A-FEF, SEF, PMdr and 24c. Yellow dotted line, areas 9 and rostral 46; dark yellow, caudal area 46; white, area 8A-FEF; green, SEF; blue-green dotted line, PMdr; grey, 24c. (c) 3-D rendering of the striatum, clipped to illustrate the relationship between focal projections from each functional region. Scale bars, 2 mm.
F<sc>ig</sc>. 13
Fig. 13
Microphotographs of adjacent coronal sections of the striatum showing the labelled terminals following dual tracer injections into different frontal areas. Labeled corticostriatal fibres following injections into (a) lateral area 9 and (b) PMdr in case 161, into (c) rostral area 46 and (d) PMdr in case 166, and into (e) areas 9 and (f) the SEF in case 184. White arrowheads indicate the corresponding blood vessels, and also the same white matter bundle in (e) and (f) in the adjacent sections. White lines in (c) and (d) indicate the border of the diffuse projections from PMdr. Note that dense clusters of fibres from (c) rostral area 46 and (d) PMdr primarily interdigitate but there is overlap between diffuse projections from these areas. There is also overlap between the diffuse projections from (e) area 9 and (f) those from the SEF. Scale bar, 100 µm (microphotographs), 5 mm (drawings illustrating the injection sites).
F<sc>ig</sc>. 12
Fig. 12
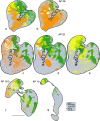
Chartings of the terminal fields from each cortical functional region, illustrating the collective diffuse projections superimposed on the focal terminal fields at four chosen AP levels: (a and b) rostral striatum (AP 26); (c–e) n. Ac (AP 22); (f) AC (AP 18.5); and (g) caudal striatum (AP 10). Yellow, areas 9 and 46; orange, area 24b; white, area 8A-FEF; green, SEF, PMdr and 24c. In (a) and (d), orange is transparent to better illustrate the convergence between focal projections from area 24b with those from areas 9 and 46; in (d)– (e), yellow is transparent to better illustrate the convergence between focal projections from areas 9 and 46 with those from areas 8A-FEF, SEF, PMdr and 24c (the convergence area appears in green); in (c), (f) and (g), white is transparent. Note that diffuse projections from each cortical region distribute to a larger striatal area, extending the territory covered by the focal projections. Scale bar, 5 mm.
F<sc>ig</sc>. 14
Fig. 14
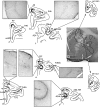
Drawings and microphotographs of the retrogradely labelled neurons following two tracer injections into the striatum at the level of the n. Ac, in the dorsal and medial Cd n. (case 170, FS) and in the medial putamen (case 170, LY), that are sites of potential convergence between projections from areas 9 and 46 (white) and SEF, PMdr and 24c (black) as predicted by the 3-D model and by the dual cortical injections. a - f: coronal sections of the brain showing the labelled corticostriatal neurons in the relevant frontal areas at different AP levels. Microphotographs show the labelled neurons in (b) medial area 9 and (c) PMdr following injection into the dorsomedial Cd n. (case 170, FS) and the labelled neurons in (d) area 9, in (e) the SEF and in dorsal and caudal area 46, and in (f) area 24c following injection into the medial putamen (case 170, LY). Scale bars, 5 mm (drawings), 500 µm (microphotographs).

Similar articles

Cited by

References

    1. Barbas H. Anatomic organization of basoventral and mediodorsal visual recipient prefrontal regions in the Rhesus monkey. J. Comp. Neurol. 1988;276:313–342. - PubMed
    1. Barbas H. Architecture and cortical connections of the prefrontal cortex in the rhesus monkey. In: Chauvel P, Delgado-Escueta AV, editors. Advances in Neurology. New York: Raven Press Ltd.; 1992. pp. 91–115. - PubMed
    1. Barbas H, Pandya DN. Architecture and frontal cortical connections of the premotor cortex (area 6) in the rhesus monkey. J. Comp. Neurol. 1987;256:211–228. - PubMed
    1. Boussaoud D. Attention versus intention in the primate premotor cortex. Neuroimage. 2001;14:S40–S45. - PubMed
    1. Bouyer JJ, Park DH, Joh TH, Pickel VM. Chemical and structural analysis of the relation between cortical inputs and tyrosine hydroxylase-containing terminals in rat neostriatum. Brain Res. 1984;302:267–275. - PubMed

Publication types