. 2007 Sep 24:8:359.
doi: 10.1186/1471-2105-8-359.

Differential analysis for high density tiling microarray data

Affiliations

Differential analysis for high density tiling microarray data

Srinka Ghosh et al. BMC Bioinformatics. .

Abstract

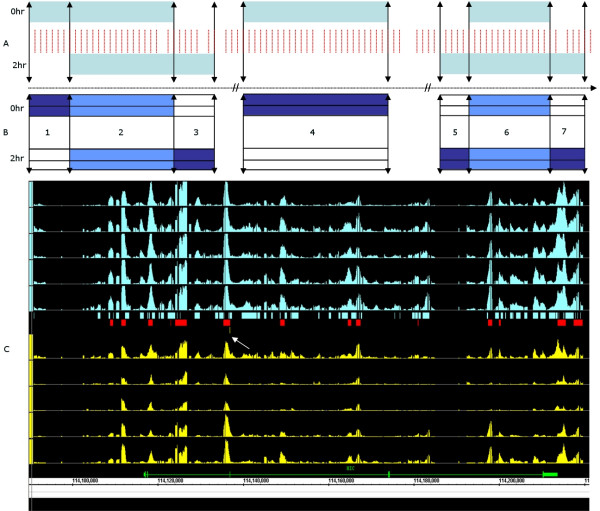
Background: High density oligonucleotide tiling arrays are an effective and powerful platform for conducting unbiased genome-wide studies. The ab initio probe selection method employed in tiling arrays is unbiased, and thus ensures consistent sampling across coding and non-coding regions of the genome. These arrays are being increasingly used to study the associated processes of transcription, transcription factor binding, chromatin structure and their association. Studies of differential expression and/or regulation provide critical insight into the mechanics of transcription and regulation that occurs during the developmental program of a cell. The time-course experiment, which comprises an in-vivo system and the proposed analyses, is used to determine if annotated and un-annotated portions of genome manifest coordinated differential response to the induced developmental program.

Results: We have proposed a novel approach, based on a piece-wise function - to analyze genome-wide differential response. This enables segmentation of the response based on protein-coding and non-coding regions; for genes the methodology also partitions differential response with a 5' versus 3' versus intra-genic bias.

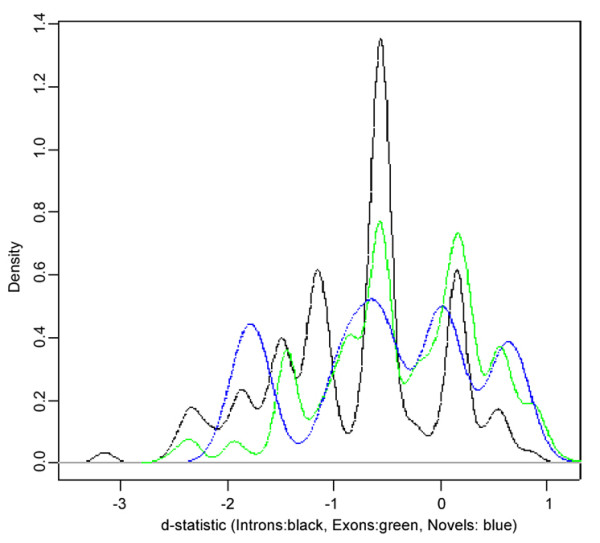
Conclusion: The algorithm built upon the framework of Significance Analysis of Microarrays, uses a generalized logic to define regions/patterns of coordinated differential change. By not adhering to the gene-centric paradigm, discordant differential expression patterns between exons and introns have been identified at a FDR of less than 12 percent. A co-localization of differential binding between RNA Polymerase II and tetra-acetylated histone has been quantified at a p-value < 0.003; it is most significant at the 5' end of genes, at a p-value < 10-13. The prototype R code has been made available as supplementary material [see Additional file 1].


Figures

Figure 1
Figure 1
(A-B) A schematic defining FragmentDomainI, FragmentDomainU and NOED. In this example, 0 and 2 hours constitute the reference and target, respectively. In panel A the probes and the enrichment regions are represented in red and light blue respectively; in panel B, the enrichment fragments FragmentDomainU: 1, 3, 5, 7: FragmentDomainI:2, 6; NOED:4. (C): This is an IGB visualization of the fragmented enrichment domains as defined in the reference (blue) and target (yellow). The SE graphs represent biological data from 5 replicates each for reference and target. There are three levels of annotation between the reference and target graphs; the annotations in blue and yellow are representative of enrichment fragments unique to the reference and target, respectively; the annotation in red is representative of the intersecting enrichment fragments. Peaks representative of the binding of putative regulatory elements are evident upstream of and at the 5'end of the HIC gene and in the first few exons and in the introns.
Figure 2
Figure 2
(A) This represents the t-statistic (green) versus d-statistic (black) distribution; the shrinkage in the tails of the latter is due to the additional variance term. (B): This is a scatter-plot of the observed (y-axis) versus expected (x-axis) d-statistic distributions, where the open circles represent the data points. The delta (±Δ) envelope (green) defined about a d-statistic of zero, indicates a null domain – such that regions above and below the positive and negative Δ cutoff indicate up-regulation and down-regulation, respectively.
Figure 3
Figure 3
(A) Distribution of the FDR versus d-statistic versus log fold change as shown in the representative 0–2 hour HisH4 data. (B) 0–2 hour HisH4 data, corroborates that no length based bias is introduced the estimation of the d-statistic and/or FDR.
Figure 4
Figure 4
The histogram summarizes the differential expression profiles in each ENCODE region on each chromosome. Chromosome region specific differential expression is observed across the time-points – 30 percent change on chromosome 8 to no detectable change on chromosome 10. Globally, the highest fraction of differential expression when summarized across all transfrag is observed between 8–32 hours (53.8 percent),. The most statistically significant (FDR ≤12 percent) changes are also observed between 8–32 hours.
Figure 5
Figure 5
D-statistic versus FDR relationship at putative TREs, across the time-series (IGB view). Examples of enrichment fragments are observed within and upstream of the second intron of the HIC gene (pink). The upstream fragment is possibly un-annotated (UA), in so far as no RefSeq annotation is available. The top four tracks represent the HisH4 p-value graphs at 0 (red), 2 (light-blue), 8 (dark-blue) and 32 (green) hours, scaled appropriately for comparison; the subsequent tracks represent the d-statistic (top) and FDR (bottom) pair for the 0–2 (red), 2–8 (cyan) and 8–32 (blue) hour time intervals. The horizontal lines associated with the FDR data refer to the 5 percent threshold in each case.
Figure 6
Figure 6
Example: For HisH4 a certain percentage of loci manifest up-regulation, while others manifest down-regulation and yet others exhibit no differential change. The time intervals 0–2 hr, 2–8 hr and 8–32 hr are shown in black, blue and red respectively.
Figure 7
Figure 7
A representative density profile of the d-statistic for change in H3K27T histone modification between 0 and 2 hours of retinoic acid treatment for the ENCODE region on chromosome 1. The curves of different colors illustrate differential change for the H3K27T modification in exonic (green), intronic (black) and intergenic (blue) regions. The shift into the negative territory for the d-statistic for all classes of regions suggest is a consistent downward trend for this modification between 0 and 2 hours.

References

    1. Elvidge G. Microarray expression technology: from start to finish. Pharmacogenomics. 2006;7:123–34. doi: 10.2217/14622416.7.1.123. - DOI - PubMed
    1. Zhang X, Kluger Y, Nakayama Y, Poddar R, Whitney C, Detora A, Weissman SM, Newburger PE. Gene expression in mature neutrophils: early responses to inflammatory stimuli. Journal of leukocyte biology. Journal Leukoc Biol. 2004;75:358–72. doi: 10.1189/jlb.0903412. - DOI - PubMed
    1. Werner SL, Barken D, Hoffmann A. Stimulus Specificity of Gene Expression Programs Determined by Temporal Control of IKK Activity. Science. 2005;309:1857–61. doi: 10.1126/science.1113319. - DOI - PubMed
    1. Grigoryev DN, Ma SF, Irizarry RA, Ye SQ, Quackenbush J, Garcia JGN. Orthologous gene-expression profiling in multi-species models search for candidate genes. Genome Biology. 2004;5:R34. doi: 10.1186/gb-2004-5-5-r34. - DOI - PMC - PubMed
    1. Tusher VG, Tibshirani R, Chu G. Significance analysis of microarrays applied to the ionizing radiation response. PNAS. 2001;98:5116–21. doi: 10.1073/pnas.091062498. - DOI - PMC - PubMed

Publication types

MeSH terms

LinkOut - more resources