

Oxygen-induced Regulation of Na/K ATPase in cerebellar granule cells
- PMID: 17893192
- PMCID: PMC2151649
- DOI: 10.1085/jgp.200709783
Oxygen-induced Regulation of Na/K ATPase in cerebellar granule cells
Abstract
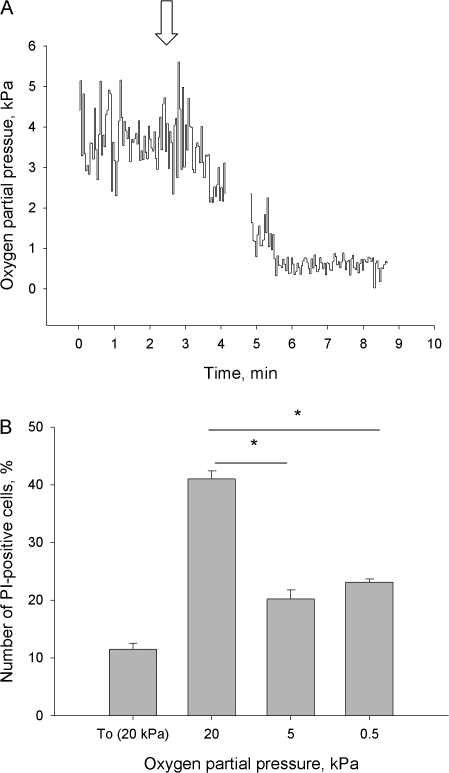
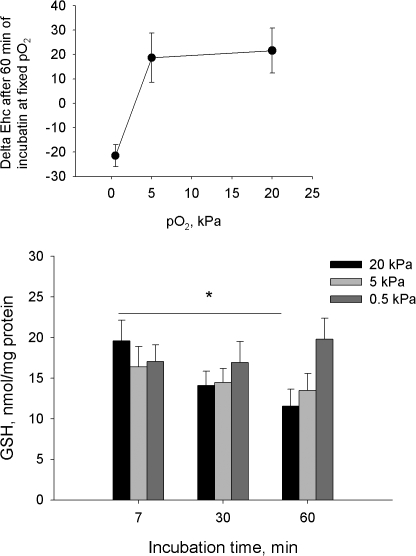
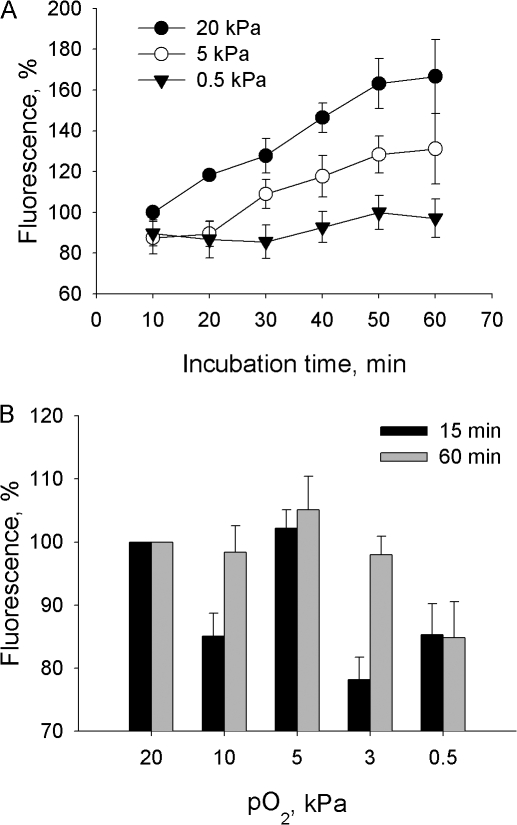
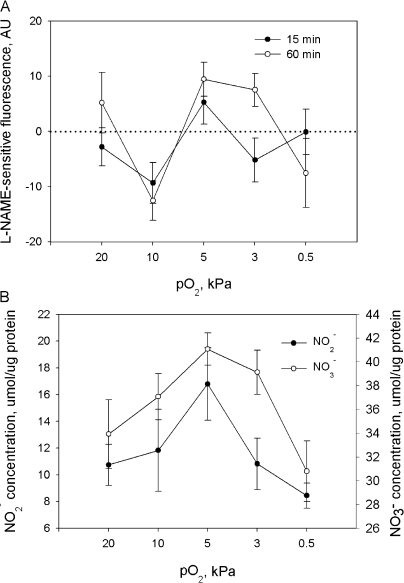
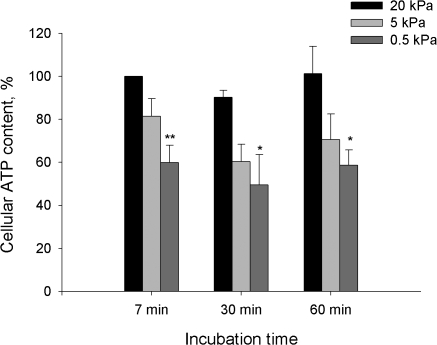
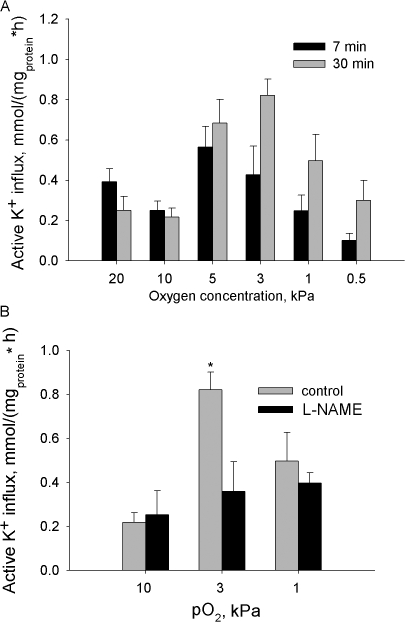
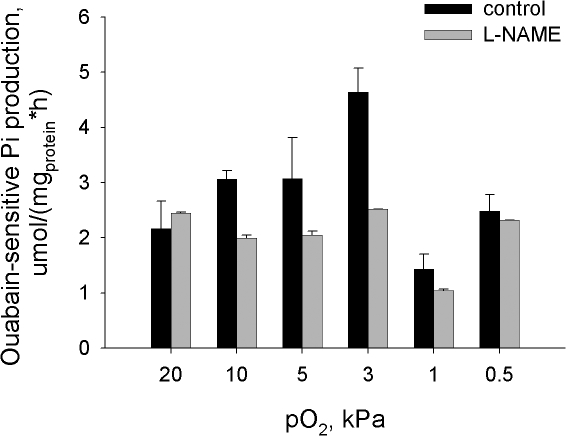
Adjustment of the Na/K ATPase activity to changes in oxygen availability is a matter of survival for neuronal cells. We have used freshly isolated rat cerebellar granule cells to study oxygen sensitivity of the Na/K ATPase function. Along with transport and hydrolytic activity of the enzyme we have monitored alterations in free radical production, cellular reduced glutathione, and ATP levels. Both active K(+) influx and ouabain-sensitive inorganic phosphate production were maximal within the physiological pO(2) range of 3-5 kPa. Transport and hydrolytic activity of the Na/K ATPase was equally suppressed under hypoxic and hyperoxic conditions. The ATPase response to changes in oxygenation was isoform specific and limited to the alpha1-containing isozyme whereas alpha2/3-containing isozymes were oxygen insensitive. Rapid activation of the enzyme within a narrow window of oxygen concentrations did not correlate with alterations in the cellular ATP content or substantial shifts in redox potential but was completely abolished when NO production by the cells was blocked by l-NAME. Taken together our observations suggest that NO and its derivatives are involved in maintenance of high Na/K ATPase activity under physiological conditions.
Figures
Similar articles
-
Hypoxic responses of Na+/K+ ATPase in trout hepatocytes.J Exp Biol. 2005 May;208(Pt 10):1793-801. doi: 10.1242/jeb.01572. J Exp Biol. 2005. PMID: 15879061
-
Na-K-ATPase in rat cerebellar granule cells is redox sensitive.Am J Physiol Regul Integr Comp Physiol. 2006 Apr;290(4):R916-25. doi: 10.1152/ajpregu.00038.2005. Epub 2005 Nov 17. Am J Physiol Regul Integr Comp Physiol. 2006. PMID: 16293684
-
[The ability of cells to adjust to the low oxigen content associated with Na,K-ATPase glutationilation].Mol Biol (Mosk). 2015 Jan-Feb;49(1):175-83. Mol Biol (Mosk). 2015. PMID: 25916122 Russian.
-
Na,K-ATPase function in alternating electric fields.FASEB J. 1992 Apr;6(7):2434-8. doi: 10.1096/fasebj.6.7.1314204. FASEB J. 1992. PMID: 1314204 Review.
-
Na/K-ATPase as an oligomeric ensemble.Biochemistry (Mosc). 2001 Aug;66(8):821-31. doi: 10.1023/a:1011964832767. Biochemistry (Mosc). 2001. PMID: 11566051 Review.
Cited by
-
"Oxygen Sensing" by Na,K-ATPase: These Miraculous Thiols.Front Physiol. 2016 Aug 2;7:314. doi: 10.3389/fphys.2016.00314. eCollection 2016. Front Physiol. 2016. PMID: 27531981 Free PMC article. Review.
-
The role of extracellular glutamate homeostasis dysregulated by astrocyte in epileptic discharges: a model evidence.Cogn Neurodyn. 2024 Apr;18(2):485-502. doi: 10.1007/s11571-023-10001-z. Epub 2023 Sep 21. Cogn Neurodyn. 2024. PMID: 38699615 Free PMC article.
-
The importance of systemic response in the pathobiology of blast-induced neurotrauma.Front Neurol. 2010 Dec 10;1:151. doi: 10.3389/fneur.2010.00151. eCollection 2010. Front Neurol. 2010. PMID: 21206523 Free PMC article.
-
Intrinsic responses to hypoxia and hypercapnia of neurons in the cardiorespiratory center of the ventral medulla of newborn rats.Pflugers Arch. 2025 May;477(5):685-705. doi: 10.1007/s00424-025-03077-5. Epub 2025 Mar 22. Pflugers Arch. 2025. PMID: 40119920
-
Distinct Effects of Beta-Amyloid, Its Isomerized and Phosphorylated Forms on the Redox Status and Mitochondrial Functioning of the Blood-Brain Barrier Endothelium.Int J Mol Sci. 2022 Dec 22;24(1):183. doi: 10.3390/ijms24010183. Int J Mol Sci. 2022. PMID: 36613623 Free PMC article.
References
-
- Balcerczyk, A., M. Soszynski, and G. Bartosz. 2005. On the specificity of 4-amino-5-methylamino-2′,7′-difluorofluorescein as a probe for nitric oxide. Free Radic. Biol. Med. 39:327–335. - PubMed
-
- Beltowski, J., A. Marciniak, A. Jamroz-Wisniewska, and E. Borkowska. 2004. Nitric oxide–superoxide cooperation in the regulation of renal Na+,K+-ATPase. Acta. Biochim. Pol. 51:933–942. - PubMed
-
- Bogdanova, A., B. Grenacher, M. Nikinmaa, and M. Gassmann. 2005. Hypoxic responses of Na/K ATPase in trout hepatocyte primary cultures. J. Exp. Biol. 208:1793–1803. - PubMed
-
- Bogdanova, A., O.O. Ogunshola, C. Bauer, M. Nikinmaa, and M. Gassmann. 2003. Molecular mechanisms of oxygen-induced regulation of Na+/K+ pump. Adv. Exp. Med. Biol. 536:231–238. - PubMed
-
- Bogdanova, A., I. Petrushanko, A. Boldyrev, and M. Gassmann. 2006. Oxygen- and redox-induced regulation of the Na/K ATPase. Curr. Enzyme Inhibition. 2:37–59.
Publication types
MeSH terms
Substances
LinkOut - more resources
Full Text Sources
Miscellaneous
