. 2007 Oct;130(4):415-25.
doi: 10.1085/jgp.200709771.

Molecular determinant for specific Ca/Ba selectivity profiles of low and high threshold Ca2+ channels

Affiliations

Molecular determinant for specific Ca/Ba selectivity profiles of low and high threshold Ca2+ channels

Thierry Cens et al. J Gen Physiol. 2007 Oct.

Abstract

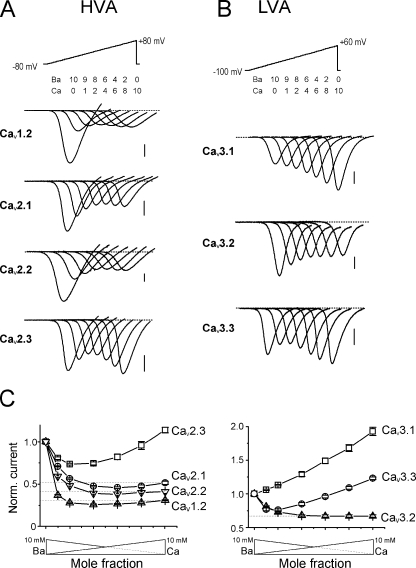
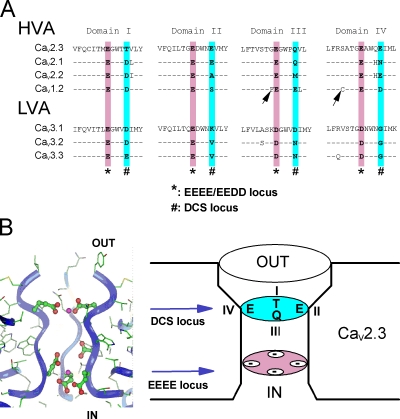
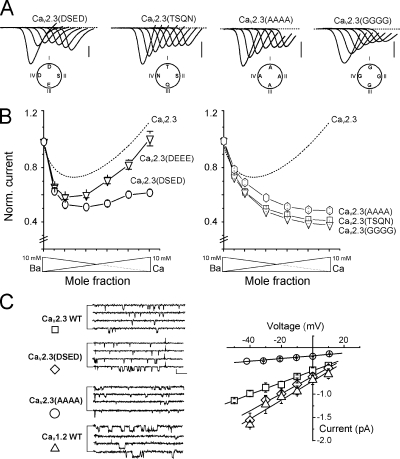
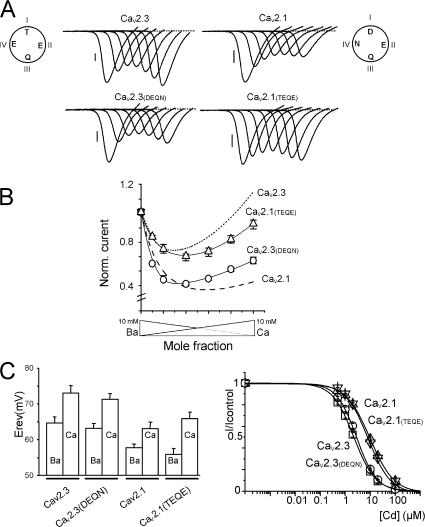
Voltage-gated Ca(2+) channels (VGCC) play a key role in many physiological functions by their high selectivity for Ca(2+) over other divalent and monovalent cations in physiological situations. Divalent/monovalent selection is shared by all VGCC and is satisfactorily explained by the existence, within the pore, of a set of four conserved glutamate/aspartate residues (EEEE locus) coordinating Ca(2+) ions. This locus however does not explain either the choice of Ca(2+) among other divalent cations or the specific conductances encountered in the different VGCC. Our systematic analysis of high- and low-threshold VGCC currents in the presence of Ca(2+) and Ba(2+) reveals highly specific selectivity profiles. Sequence analysis, molecular modeling, and mutational studies identify a set of nonconserved charged residues responsible for these profiles. In HVA (high voltage activated) channels, mutations of this set modify divalent cation selectivity and channel conductance without change in divalent/monovalent selection, activation, inactivation, and kinetics properties. The Ca(V)2.1 selectivity profile is transferred to Ca(V)2.3 when exchanging their residues at this location. Numerical simulations suggest modification in an external Ca(2+) binding site in the channel pore directly involved in the choice of Ca(2+), among other divalent physiological cations, as the main permeant cation for VGCC. In LVA (low voltage activated) channels, this locus (called DCS for divalent cation selectivity) also influences divalent cation selection, but our results suggest the existence of additional determinants to fully recapitulate all the differences encountered among LVA channels. These data therefore attribute to the DCS a unique role in the specific shaping of the Ca(2+) influx between the different HVA channels.


Figures

Figure 1.
Figure 1.
Low and high voltage–activated Ca2+ channels have specific Ca2+/Ba2+ selectivities. (A and B) Representative current traces recorded in oocytes expressing HVA CaV1.2, CaV2.1, CaV2.2, or CaV2.3 and α2-δ + β2 Ca2+ channel subunits (A) or LVA CaV3.1, CaV3.2, or CaV3.3 Ca2+ channels (B) using solutions of different Ca2+ mole fractions (Ba2+/Ca2+: 10/0, 9/1, 8/2, 6/4, 4/6, 2/8, and 0/10 mM). Whole-cell currents were recorded during voltage ramps from −80 to +80 mV (A) or from −100 to +60 mV (B) at a speed of 0.4 to 2.6 V/s applied every 15 s. Bars, 100 nA. (C) Normalized current/mole fraction curves obtained from recordings similar to those in A or B by plotting the peak current of the IV curve against the Ca/Ba mole fraction. Note the different ICa/IBa ratios and the presence/absence of AMFE in each case. Left, averaged curves obtained from oocytes expressing CaV1.2 (▵), CaV2.1 (○), CaV2.2 (▿), or CaV2.3 (□) HVA VGCC. Right, curves obtained from oocytes expressing CaV3.1 (□), CaV3.2 (▵) or CaV3.3 (○) LVA VGCC.
Figure 2.
Figure 2.
Molecular modeling of the DCS and EEEE loci in the channel pore. (A) Sequence alignment of the P loops of CaV1.2, CaV2.1, and CaV2.3 HVA channels and CaV3.1, CaV3.2, and CaV3.3 LVA channels. * and # boxes, position of EEEE and DCS loci in each domain of the CaVα subunit. Note the nonconservation of the DCS charged amino acids. Arrows underline the non-DCS amino acids mutated in Fig S4: S1611 and G1323 in CaV2.3. (B) A molecular model of the C-terminal end of the four P loops of CaV2.3 channel. Left, radial projection of the channel with one of the domains omitted for the clearness of the picture. Right, schematic representation of the EEEE and DCS loci of CaV2.3 channel. Ribbons represent the backbone of the peptidic chains. Ca2+ ions are shown as magenta balls. Negatively charged side chains of the channel are shown by ball-and-stick representation (see Materials and methods for details).
Figure 3.
Figure 3.
Mutations at the DCS locus suppress anomalous mole fraction of HVA. The four amino acids of the CaV2.3 DCS locus were mutated by adding or removing negatively charged residues. (A) Typical current traces recorded during voltage ramps under different ionic conditions (see Fig. 1) applied to oocytes expressing CaV2.3 channels with their DCS loci mutated in DSED (one negative charge added, CaV2.3(DSED)), DEEE (two negative charges added, CaV2.3(DEEE)), TSQN, AAAA, or GGGG (two negative charges removed, CaV2.3(TSQN), CaV2.3(AAAA) or CaV2.3 (GGGG)). (B) Current–mole fraction curves obtained for the above mutations. Right, effect of adding negative charges (CaV2.3(DSED), ○; CaV2.3 (DEEE), ▿). Left, effect of removing negative charges (CaV2.3(TSQN), □; CaV2.3 (AAAA), hexagone; CaV2.3 (GGGG), ▿). Note that the removal of the negative charges suppressed AMFE in all three cases. The dotted line represents the curve obtained with the WT CaV2.3 in Fig. 1. (C) Single-channel conductances of CaV2.3, CaV2.3(DSED), CaV2.3(AAAA), and CaV1.2 VGCC. Left, current traces in 100 mM BaCl2 (pipette potential = +10 mV, except CaV2.3(AAAA) −20 mV). Right, current–voltage curves with superimposed linear regressions (13 ± 1 pS, 21 ± 1 pS, 4 ± 1 pS, and 22 ± 1 pS for CaV2.3, CaV2.3(DSED), CaV2.3(AAAA), and CaV1.2, respectively). Bar, 0.5 pA, 25 ms.
Figure 4.
Figure 4.
DCS locus controls the channel-specific cation selectivity profile. (A and B) A CaV2.3 channel with an engineered CaV2.1 DCS locus (CaV2.3(DEQN), square) displays AMFE and has an ICa/IBa ratio similar to CaV2.1. Conversely, a Ca2.1 channel with a CaV2.3 DCS locus (CaV2.1(TEQE), ▵) behaves like CaV2.3. (A) Current traces and (B) current–mole fraction curves. Dashed lines, current/mole fraction curves of parent channels, CaV2.3 and CaV2.1, determined in Fig. 1. (C) The current reversal potentials, recorded in 10 mM Ca2+ or 10 mM Ba2+ (left), and the Cd2+ block of Ba2+ current (right) for CaV2.3 (□) and CaV2.1(▿) channels are not changed by the mutations (CaV2.3(DEQN), ○; and CaV2.1(TEQE), ▵), suggesting the EEEE locus is not modified.
Figure 5.
Figure 5.
AMFE amplitude is correlated with the number of negative charges at the DCS. Scatterplot showing the amplitude of AMFE (calculated as the minimum of the current–mole fraction curve divided by the current in 10 mM Ca2+) as a function of the number of negative charges for all the HVA mutations presented in this article.
Figure 6.
Figure 6.
Mutations at the DCS locus modify selectivity profiles of LVA without changes in gating. (A) Schematic representation of the amino acids present at the CaV3.1, CaV3.2, and CaV3.3 DCS loci. (B) Current–mole fraction curves obtained for the WT (▵) and two mutant CaV3.2 LVA channels mimicking the DCS loci of CaV3.1 (CaV3.2(DKDG), □) and CaV3.3 (CaV3.2(EVNG), ○). Ba/Ca current ratio was significantly changed for the CaV3.2(DKDG) mutant that also displayed a small AMFE as opposed to WT CaV3.2. (C) Voltage-dependent parameters of the current–voltage curves and inactivation curves of the CaV3.2, CaV3.2(EVNG), and CaV3.2(DKDG) LVA channels. These two mutations were without noticeable effects on these parameters.
Figure 7.
Figure 7.
Numerical computation predicts mutant behavior. (A) Schematic representation of the energy profile used for computer modeling of the three barriers–two sites channel model. Barriers (P1, P2, P3) and wells (DCS and EEEE) are spaced equally (see Materials and methods). Membrane voltage drops across the narrow portion of the channel. (B, left) Simulated ICa/IBa ratios calculated for decreasing free energies at the external DCS locus of the CaV2.3 channel. The bell-shaped relation obtained for the DCS locus reached a maximum when DCS ΔG° equals the energy of the internal site. (B, right) Simulated current–mole fraction curves with three out of the four decreasing DCS ΔG° depicted on the left. These curves were labeled CaV1.2, CaV2.3(DEEE), and CaV2.3(GGGG), after comparison with original traces shown in Figs. 1 and 3, and suspected variations in free energy at DCS locus due to mutation. (C) Simulated ICa/IBa ratios calculated for decreasing free energies at the external DCS locus of the CaV3.1 channel. Energy profile of CaV3.1 was first adapted from CaV2.3 by adjusting the ΔG° at the EEEE locus considering that this locus in LVA channels (EEDD) has lower affinity for Ca2+. Simulated current–mole fraction curves were then obtained by decreasing ΔG° at the DCS locus. Traces were labeled after comparison with original traces shown in Fig. 1 and suspected variations in free energy at DCS for the purpose of discussion.

Similar articles

Cited by

References

    1. Almers, W., E.W. McCleskey, and P.T. Palade. 1984. A non-selective cation conductance in frog muscle membrane blocked by micromolar external calcium ions. J. Physiol. 353:565–583. - PMC - PubMed
    1. Begenisich, T.B., and M.D. Cahalan. 1980. Sodium channel permeation in squid axons. I: Reversal potential experiments. J. Physiol. 307:217–242. - PMC - PubMed
    1. Bourinet, E., Zamponi, G.W., Stea, A., Soong, T.W., Lewis, B.A., Jones, L.P., Yue, D.T., and Snutch, T.P. 1996. The α1E calcium channel exhibits permeation properties similar to low-voltage-activated calcium channels. J. Neurosci. 16:4983–4993. - PMC - PubMed
    1. Campbell, D.L., R.L. Rasmusson, and H.C. Strauss. 1988. Theoretical study of the voltage and concentration dependence of the anomalous mole fraction effect in single calcium channels. New insights into the characterization of multi-ion channels. Biophys. J. 54:945–954. - PMC - PubMed
    1. Catterall, W.A. 2000. Structure and regulation of voltage-gated Ca2+ channels. Annu. Rev. Cell Dev. Biol. 16:521–555. - PubMed

Publication types

MeSH terms