

Class A scavenger receptors regulate tolerance against apoptotic cells, and autoantibodies against these receptors are predictive of systemic lupus
- PMID: 17893199
- PMCID: PMC2118440
- DOI: 10.1084/jem.20070600
Class A scavenger receptors regulate tolerance against apoptotic cells, and autoantibodies against these receptors are predictive of systemic lupus
Abstract
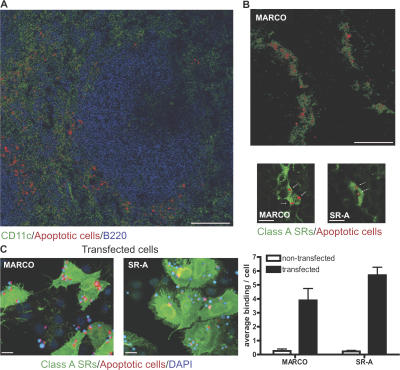
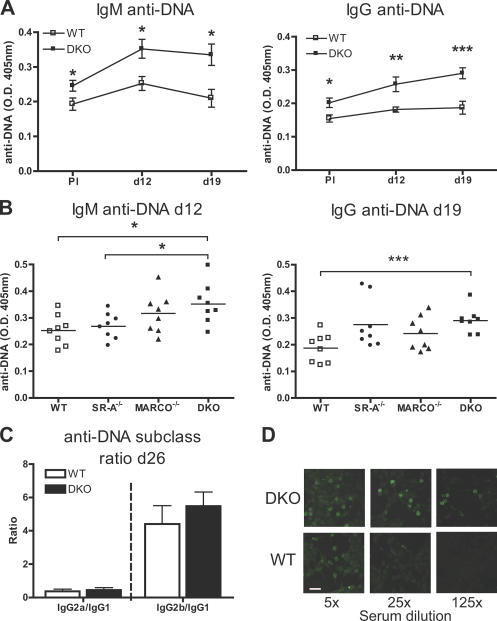
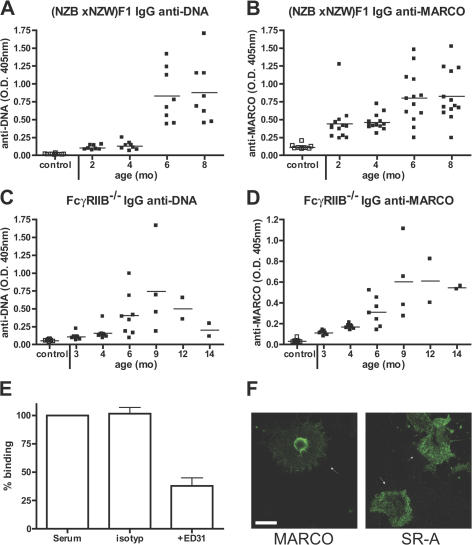
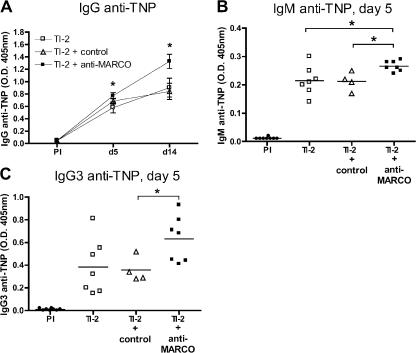
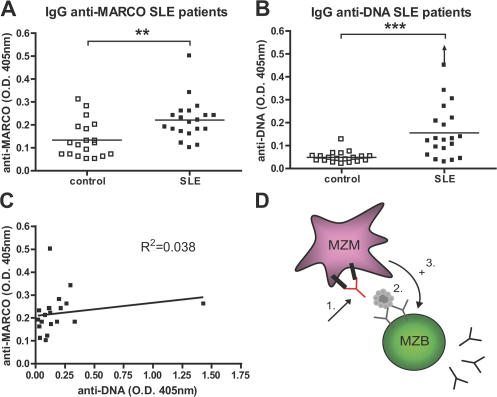
Apoptotic cells are considered to be a major source for autoantigens in autoimmune diseases such as systemic lupus erythematosus (SLE). In agreement with this, defective clearance of apoptotic cells has been shown to increase disease susceptibility. Still, little is known about how apoptotic cell-derived self-antigens activate autoreactive B cells and where this takes place. In this study, we find that apoptotic cells are taken up by specific scavenger receptors expressed on macrophages in the splenic marginal zone and that mice deficient in these receptors have a lower threshold for autoantibody responses. Furthermore, antibodies against scavenger receptors are found before the onset of clinical symptoms in SLE-prone mice, and they are also found in diagnosed SLE patients. Our findings describe a novel mechanism where autoantibodies toward scavenger receptors can alter the response to apoptotic cells, affect tolerance, and thus promote disease progression. Because the autoantibodies can be detected before onset of disease in mice, they could have predictive value as early indicators of SLE.
Figures
Similar articles
-
The role of apoptosis in autoimmunity: immunogen, antigen, and accelerant.Semin Nephrol. 1999 Jan;19(1):34-47. Semin Nephrol. 1999. PMID: 9952279 Review.
-
Opsonization of late apoptotic cells by systemic lupus erythematosus autoantibodies inhibits their uptake via an Fcgamma receptor-dependent mechanism.Arthritis Rheum. 2007 Oct;56(10):3399-411. doi: 10.1002/art.22947. Arthritis Rheum. 2007. PMID: 17907194
-
Antigen localization within the splenic marginal zone restores humoral immune response and IgG class switch in complement C4-deficient mice.Int Immunol. 2004 Dec;16(12):1685-90. doi: 10.1093/intimm/dxh159. Epub 2004 Oct 11. Int Immunol. 2004. PMID: 15477230
-
Anti-class a scavenger receptor autoantibodies from systemic lupus erythematosus patients impair phagocytic clearance of apoptotic cells by macrophages in vitro.Arthritis Res Ther. 2011 Jan 31;13(1):R9. doi: 10.1186/ar3230. Arthritis Res Ther. 2011. PMID: 21281474 Free PMC article.
-
SLE--a disease of clearance deficiency?Rheumatology (Oxford). 2005 Sep;44(9):1101-7. doi: 10.1093/rheumatology/keh693. Epub 2005 May 31. Rheumatology (Oxford). 2005. PMID: 15928001 Review.
Cited by
-
Wiskott-Aldrich syndrome protein (WASP) and N-WASP are critical for peripheral B-cell development and function.Blood. 2012 Apr 26;119(17):3966-74. doi: 10.1182/blood-2010-09-308197. Epub 2012 Mar 12. Blood. 2012. PMID: 22411869 Free PMC article.
-
PPAR-delta senses and orchestrates clearance of apoptotic cells to promote tolerance.Nat Med. 2009 Nov;15(11):1266-72. doi: 10.1038/nm.2048. Epub 2009 Oct 18. Nat Med. 2009. PMID: 19838202 Free PMC article.
-
Cell death in the pathogenesis of systemic lupus erythematosus and lupus nephritis.Clin Immunol. 2017 Dec;185:59-73. doi: 10.1016/j.clim.2016.08.010. Epub 2016 Aug 9. Clin Immunol. 2017. PMID: 27519955 Free PMC article. Review.
-
Selective Memory to Apoptotic Cell-Derived Self-Antigens with Implications for Systemic Lupus Erythematosus Development.J Immunol. 2016 Oct 1;197(7):2618-26. doi: 10.4049/jimmunol.1401129. Epub 2016 Aug 24. J Immunol. 2016. PMID: 27559051 Free PMC article.
-
Deletion of WASp and N-WASp in B cells cripples the germinal center response and results in production of IgM autoantibodies.J Autoimmun. 2015 Aug;62:81-92. doi: 10.1016/j.jaut.2015.06.003. Epub 2015 Jul 2. J Autoimmun. 2015. PMID: 26143192 Free PMC article.
References
-
- Lopes-Carvalho, T., and J.F. Kearney. 2004. Development and selection of marginal zone B cells. Immunol. Rev. 197:192–205. - PubMed
-
- Martin, F., and J.F. Kearney. 2002. Marginal-zone B cells. Nat. Rev. Immunol. 2:323–335. - PubMed
-
- Enzler, T., G. Bonizzi, G.J. Silverman, D.C. Otero, G.F. Widhopf, A. Anzelon-Mills, R.C. Rickert, and M. Karin. 2006. Alternative and classical NF-kappa B signaling retain autoreactive B cells in the splenic marginal zone and result in lupus-like disease. Immunity. 25:403–415. - PubMed
Publication types
MeSH terms
Substances
LinkOut - more resources
Full Text Sources
Other Literature Sources
Medical
Molecular Biology Databases
Miscellaneous
