. 2007 Oct 1;204(10):2473-85.
doi: 10.1084/jem.20070784. Epub 2007 Sep 24.

Superior control of HIV-1 replication by CD8+ T cells is reflected by their avidity, polyfunctionality, and clonal turnover

Affiliations

Superior control of HIV-1 replication by CD8+ T cells is reflected by their avidity, polyfunctionality, and clonal turnover

Jorge R Almeida et al. J Exp Med. .

Abstract

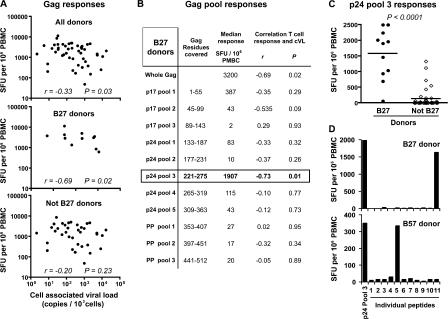
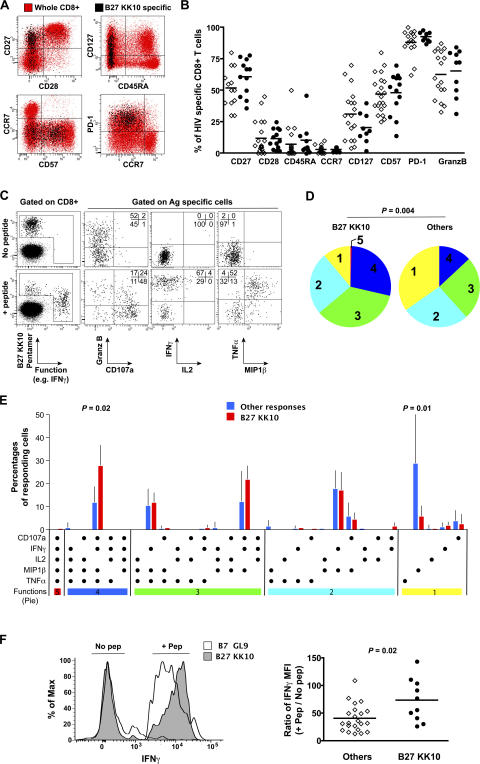
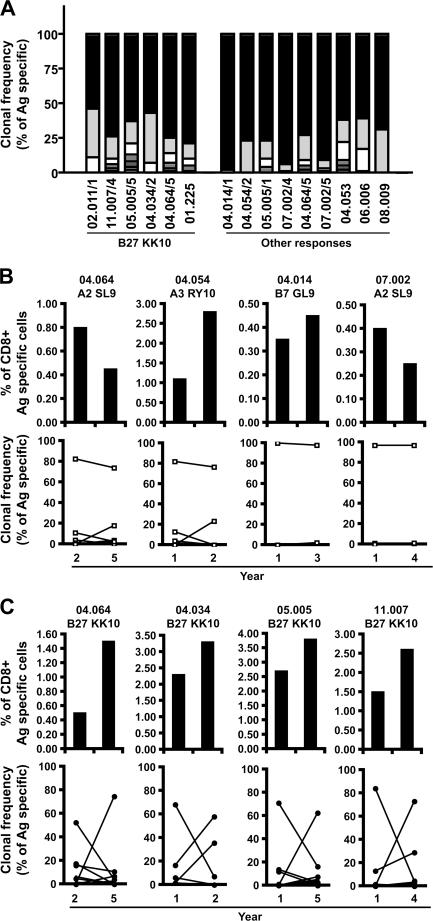
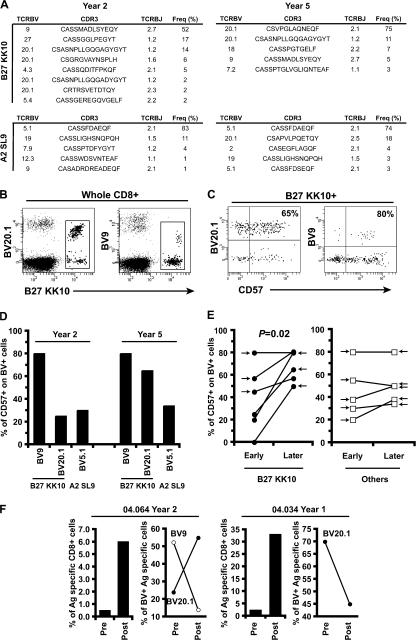
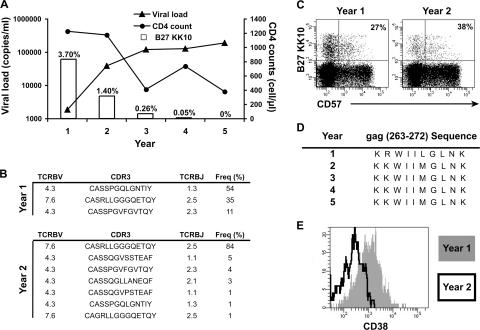
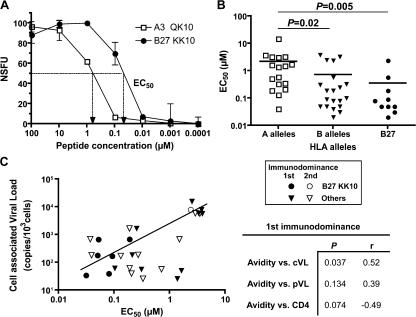
The key attributes of CD8+ T cell protective immunity in human immunodeficiency virus (HIV) infection remain unclear. We report that CD8+ T cell responses specific for Gag and, in particular, the immunodominant p24 epitope KK10 correlate with control of HIV-1 replication in human histocompatibility leukocyte antigen (HLA)-B27 patients. To understand further the nature of CD8+ T cell-mediated antiviral efficacy, we performed a comprehensive study of CD8+ T cells specific for the HLA-B27-restricted epitope KK10 in chronic HIV-1 infection based on the use of multiparametric flow cytometry together with molecular clonotypic analysis and viral sequencing. We show that B27-KK10-specific CD8+ T cells are characterized by polyfunctional capabilities, increased clonal turnover, and superior functional avidity. Such attributes are interlinked and constitute the basis for effective control of HIV-1 replication. These data on the features of effective CD8+ T cells in HIV infection may aid in the development of successful T cell vaccines.


Figures

Figure 1.
Figure 1.
Association between Gag-specific CD8+ T cell responses and viral load in HLA-B27 individuals. (A) Total CD8+ T cells responses specific for the Gag protein were assessed in IFN-γ ELISPOT assays by stimulation with overlapping peptides of PBMCs from 47 antiretroviral therapy–naive HIV-infected donors, including 11 HLA-B27 donors. Magnitude (in SFU per 106 PBMCs) of responding cells specific for Gag was plotted as a function of cVL for all 47 donors, the 11 HLA-B27 donors, and the 36 non–HLA-B27 donors. Correlations were determined using the Spearman's rank test. (B) Subdivision of Gag-specific responses from HLA-B27 donors according to peptide pools. Median responses for the 11 HLA-B27 donors are shown for each pool, and correlations between T cell frequencies and cVL were calculated. (C) Frequency of T cells responding to p24 pool 3 in HLA-27 and non–HLA-B27 donors. Horizontal bars represent means. The p-value was calculated by the Mann-Whitney U test. (D) Representative examples of HLA-B27 and HLA-B57 donor responses to individual peptides (n = 11) included in p24 pool 3. Peptide 11 covers Gag residues 261–275. Gag-specific responses were assessed in duplicate, and CD8+ T cell–depleted PBMCs were used to verify that observed responses were CD8+ T cell mediated.
Figure 2.
Figure 2.
Phenotypic and functional assessment of B27-KK10–specific CD8+ T cells. (A) Representative staining for the expression of cell surface markers on B27-KK10–specific CD8+ T cells. HIV-specific cells identified using MHC class I–peptide complexes (black) are superimposed on the whole CD8+ T cell population in the same donor (red). Plots are gated on CD3+CD8+ cells. (B) Comparative marker expression between B27-KK10–specific CD8+ T cells (open diamonds) and other HIV-specific CD8+ T cells (closed circles). Horizontal bars show medians. (C) Representative example of simultaneous multifunctional assessment of B27-KK10–specific CD8+ T cells using nine-color flow cytometry. Cells were stimulated for 6 h in the presence of cognate peptide before intracellular staining. Percentages of cells in the different quadrants are shown. Plots are gated on CD3+CD8+ cells. (D) The pie charts depict the background-adjusted multifunctional behavior (one to five functions: CD107a, IFN-γ, TNF-α, IL-2, and MIP-1β) of B27-KK10–specific CD8+ T cell populations (n = 8) versus other HIV-specific CD8+ T cell populations (n = 7, including 2xA3-RY10, 2xB7-GL9, and 3xA2-SL9). For simplicity, responses are grouped by the number of functions (indicated by the numbers inside the pie charts and matched to the colored bars in E). The p-value was calculated by the permutation test. (E) Detailed functional responsiveness was analyzed for the B27-KK10–specific CD8+ T cell populations compared with the other HIV-specific CD8+ T cell populations. Each bar shows the mean percentages of cells displaying a particular combination of functions within the total of functional cells. p-values were calculated by the Mann-Whitney U test. (F) IFN-γ fluorescence of B27-KK10–specific CD8+ T cells and other HIV-specific CD8+ T cells upon stimulation with cognate peptides. Representative profiles are shown (left), and the IFN-γ MFI ratios (for antigen-specific CD8+ T cells upon stimulation/no activation) are presented for all populations studied (right). Horizontal bars represent means.
Figure 3.
Figure 3.
High turnover of B27-KK10–specific CD8+ T cell clonotypes. (A) Clonal composition of several CD8+ T cell populations specific for B27-KK10 or other epitopes. Clonotypic analysis was performed on FACS-sorted viable HIV-specific CD8+ T cells. The percent frequencies of single clonotypes within B27-KK10 or other HIV epitope–specific CD8+ T cell populations are shown; each bar represents one population from one donor and is subdivided into distinct clonotypes represented according to frequency. 6 B27-KK10 and 9 out of 13 other HIV epitope–specific CD8+ T cell populations are shown. Donor identification is provided under the bars, and a detailed clonotypic analysis (with sequences) is shown in Table I and Table S1. (B and C) Analysis of clonal dominance over two time points. The percent frequencies of HIV-specific CD8+ T cells, identified by cognate MHC class I–peptide multimeric complexes, within the total CD8+ population and clonal composition, represented as the frequency of individual clonotypes within sorted HIV-specific CD8+ T cell populations, are shown for four B27-KK10 (C) and four other HIV peptide–specific CD8+ T cell populations (B) separated by the indicated intervals. Donor identification and specific responses are indicated; a detailed clonotypic analysis with sequences is shown in Table S1.
Figure 4.
Figure 4.
Changes in CD57 expression on B27-KK10–specific CD8+ T cell clonotypes. (A) Clonal analysis (including TCRBV usage, CDR3 aa sequence, TCRBJ usage, and percent frequency) of the B27-KK10– and A2-SL9–specific CD8+ T cell populations present in patient 04.064 at two time points (representing a total of 292 TCRB sequences). Representative examples of B27-KK10 pentamer and anti-TCRBV costaining on CD8+ T cells (B), and of anti-TCRBV and CD57 costaining on B27-KK10–gated CD8+ T cells (patient 04.064, year 5; C) are shown. Numbers represent percentages of CD57+ cells within the BV+/pentamer+ populations. (D) CD57 expression on TCRBV+ B27-KK10– or A2-SL9–specific CD8+ T cell populations for patient 04.064. (E) CD57 expression on TCRBV+ B27-KK10– or other HIV-specific CD8+ T cell populations for the seven patients studied. Clonotypes that are dominant at one of the two time points (for B27-KK10) or the two time points (for the other) are presented; the arrows indicate the time of dominance. The p-value was calculated by the paired t test. (F) The percent frequency of B27-KK10–specific CD8+ T cells and the expression of TCRBV-characterizing dominant clonotypes before (Pre) or after (Post) 9 d of in vitro expansion in the presence of KK10 peptide and IL-2.
Figure 5.
Figure 5.
Disappearance of one B27-KK10–specific CD8+ T cell clonotype and loss of control of HIV replication. (A) 5-yr follow-up (pVL, CD4 counts, and percent frequency of B27-KK10–specific CD8+ T cells) in one patient (02.011) with sudden disease progression at year 2. (B) Clonal analysis (TCRBV usage, CDR3 aa sequence, TCRBJ usage, and percent frequency) of B27-KK10–specific CD8+ T cell populations is shown for years 1 and 2 (representing a total of 150 TCRB sequences). (C) CD57 expression on B27-KK10–specific CD8+ T cells. Percentages of pentamer+ cells that express CD57 are indicated. (D) KK10 viral sequence of the dominant (i.e., >80%) HIV-1 strain over time. (E) CD38 expression on B27-KK10–specific CD8+ T cells at years 1 and 2.
Figure 6.
Figure 6.
CD8+ T cell functional avidity and control of viral replication. (A) Representative example of peptide titrations in IFN-γ ELISPOT assays (normalized SFC per 106 PBMCs) to assess functional avidity of KK10 or other HIV epitope–specific CD8+ T cells. Functional avidity is defined as the concentration required to achieve half-maximal recognition of the wild-type peptide (EC50). Error bar values are 95% confidence intervals. (B) Functional avidity of CD8+ T cell populations specific for HLA-A–restricted (including 2, 3, 11, 26, and 31) or HLA-B–restricted (including 7, 8, 27, 35, and 51) HIV epitopes (n = 20), as well as for B27-KK10. Horizontal bars represent means. p-values were calculated by the Mann-Whitney U test. (C) Correlation between functional avidity of immunodominant HIV-specific CD8+ T cell responses and HIV cVL. Immunodominant (n = 16, closed symbols) and the highest subdominant (n = 12, open symbols) responses are shown, as is a linear regression trend line. p-values and r values between cVL, pVL, CD4 count, and functional avidity are shown for the immunodominant responses. Spearman's rank test was used to determine correlations.

References

    1. Gea-Banacloche, J.C., S.A. Migueles, L. Martino, W.L. Shupert, A.C. McNeil, M.S. Sabbaghian, L. Ehler, C. Prussin, R. Stevens, L. Lambert, et al. 2000. Maintenance of large numbers of virus-specific CD8+ T cells in HIV-infected progressors and long-term nonprogressors. J. Immunol. 165:1082–1092. - PubMed
    1. Betts, M.R., D.R. Ambrozak, D.C. Douek, S. Bonhoeffer, J.M. Brenchley, J.P. Casazza, R.A. Koup, and L.J. Picker. 2001. Analysis of total human immunodeficiency virus (HIV)-specific CD4(+) and CD8(+) T-cell responses: relationship to viral load in untreated HIV infection. J. Virol. 75:11983–11991. - PMC - PubMed
    1. Kaslow, R.A., M. Carrington, R. Apple, L. Park, A. Munoz, A.J. Saah, J.J. Goedert, C. Winkler, S.J. O'Brien, C. Rinaldo, et al. 1996. Influence of combinations of human major histocompatibility complex genes on the course of HIV-1 infection. Nat. Med. 2:405–411. - PubMed
    1. Magierowska, M., I. Theodorou, P. Debre, F. Sanson, B. Autran, Y. Riviere, D. Charron, and D. Costagliola. 1999. Combined genotypes of CCR5, CCR2, SDF1, and HLA genes can predict the long-term nonprogressor status in human immunodeficiency virus-1-infected individuals. Blood. 93:936–941. - PubMed
    1. O'Brien, S.J., G.W. Nelson, C.A. Winkler, and M.W. Smith. 2000. Polygenic and multifactorial disease gene association in man: Lessons from AIDS. Annu. Rev. Genet. 34:563–591. - PubMed

Publication types