

Role of perfusion CT in glioma grading and comparison with conventional MR imaging features
- PMID: 17893216
- PMCID: PMC8134232
- DOI: 10.3174/ajnr.A0688
Role of perfusion CT in glioma grading and comparison with conventional MR imaging features
Abstract
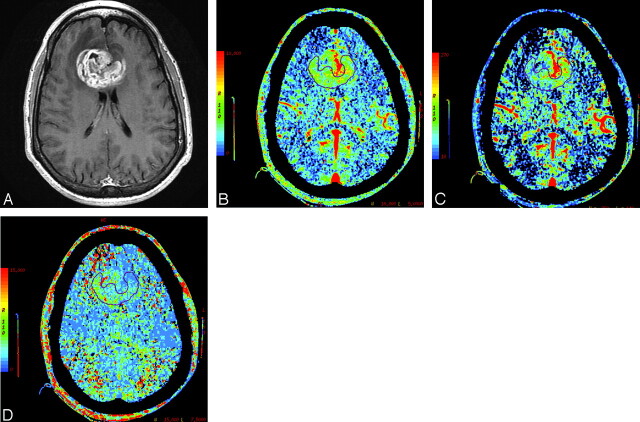
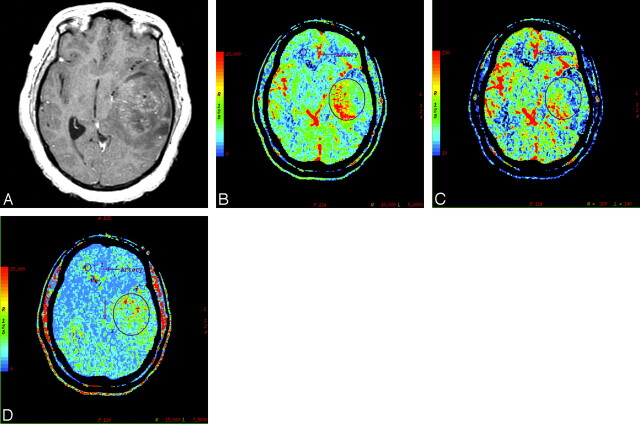
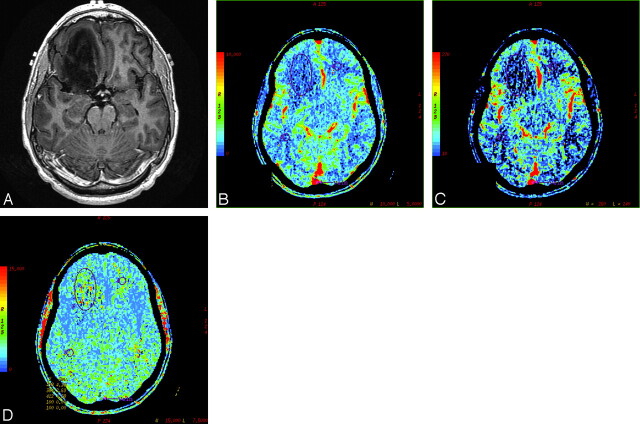
Background and purpose: Perfusion imaging using CT can provide additional information about tumor vascularity and angiogenesis for characterizing gliomas. The purpose of our study was to demonstrate the usefulness of various perfusion CT (PCT) parameters in assessing the grade of treatment-naïve gliomas and also to compare it with conventional MR imaging features.
Materials and methods: PCT was performed in 19 patients with glioma (14 high-grade gliomas and 5 low-grade gliomas). Normalized ratios of the PCT parameters (normalized cerebral blood volume [nCBV], normalized cerebral blood flow [nCBF], normalized mean transit time [nMTT]) were used for final analysis. Conventional MR imaging features of these tumors were assessed separately and compared with PCT parameters. Low- and high-grade gliomas were compared by using the nonparametric Wilcoxon 2-sample tests.
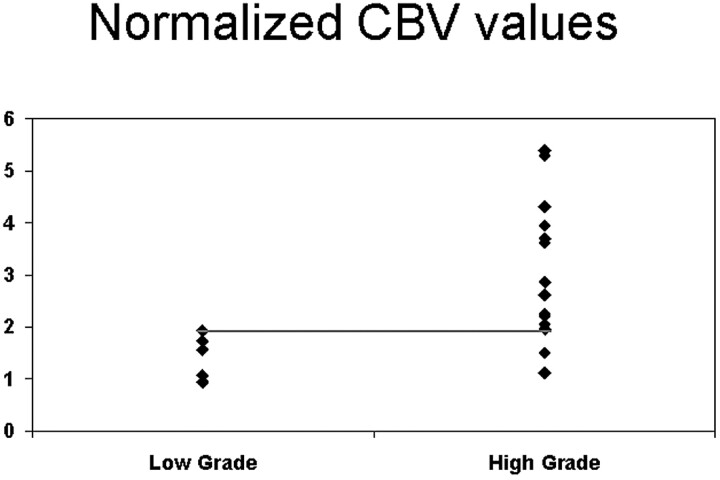
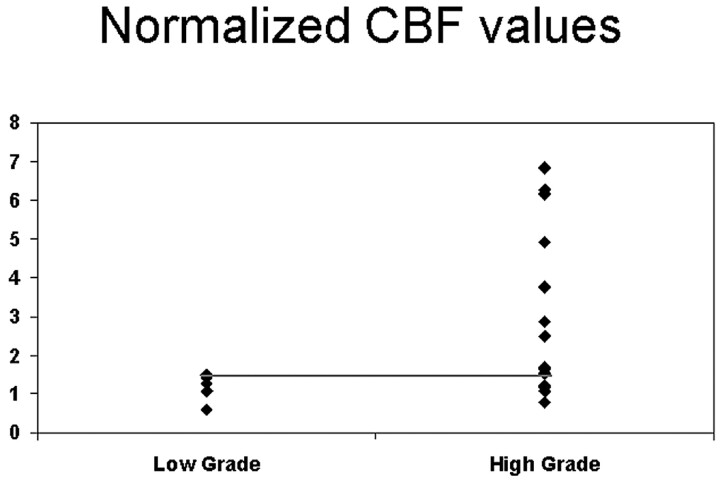
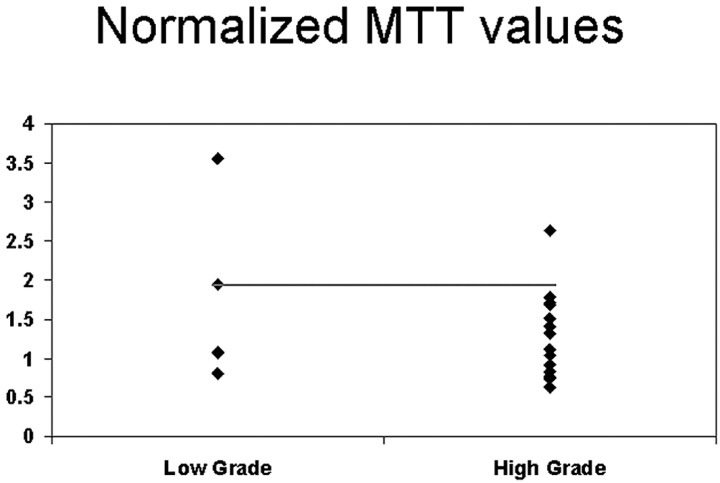
Results: Mean nCBV in the high- and low-grade gliomas was 3.06 +/- 1.35 and 1.44 +/- 0.42, respectively, with a statistically significant difference between the 2 groups (P = .005). Mean nCBF for the high- and low-grade gliomas was 3.03 +/- 2.16 and 1.16 +/- 0.36, respectively, with a statistically significant difference between the 2 groups (P = .045). Cut points of >1.92 for nCBV (85.7% sensitivity and 100% specificity), >1.48 for nCBF (71.4% sensitivity and 100% specificity), and <1.94 for nMTT (92.9% sensitivity and 40% specificity) were found to identify the high-grade gliomas. nCBV was the single best parameter; however, using either nCBV of >1.92 or nCBF of >1.48 improved the sensitivity and specificity to 92.9% and 100%, respectively. The sensitivity and specificity for diagnosing a high-grade glioma with conventional MR imaging were 85.7% and 60%, respectively.
Conclusions: PCT can be used for preoperative grading of gliomas and can provide valuable complementary information about tumor hemodynamics, not available with conventional imaging techniques. nCBV was the single best parameter correlating with glioma grades, though using nCBF when nCBV was <1.92 improved the sensitivity. An nCBV threshold of >1.92 was found to identify the high-grade gliomas.
Figures
References
-
- Law M, Cha S, Knopp EA, et al. High-grade gliomas and solitary metastases: differentiation by using perfusion and proton spectroscopic MR imaging. Radiology 2002;222:715–21 - PubMed
-
- Aronen HJ, Gazit IE, Louis DN, et al. Cerebral blood volume maps of gliomas: comparison with tumour grade and histologic findings. Radiology 1994;191:41–51 - PubMed
-
- Folkman J. The role of angiogenesis in tumor growth. Semin Cancer Biol 1992;3:65–71 - PubMed
-
- Nugent LJ, Jain RK. Extravascular diffusion in normal and neoplastic tissues. Cancer Res 1984;44:238–44 - PubMed
Publication types
MeSH terms
Substances
LinkOut - more resources
Full Text Sources
Medical