. 2007 Sep 24;178(7):1109-20.
doi: 10.1083/jcb.200703186.

APC mutations lead to cytokinetic failures in vitro and tetraploid genotypes in Min mice

Affiliations

APC mutations lead to cytokinetic failures in vitro and tetraploid genotypes in Min mice

Christine M Caldwell et al. J Cell Biol. .

Abstract

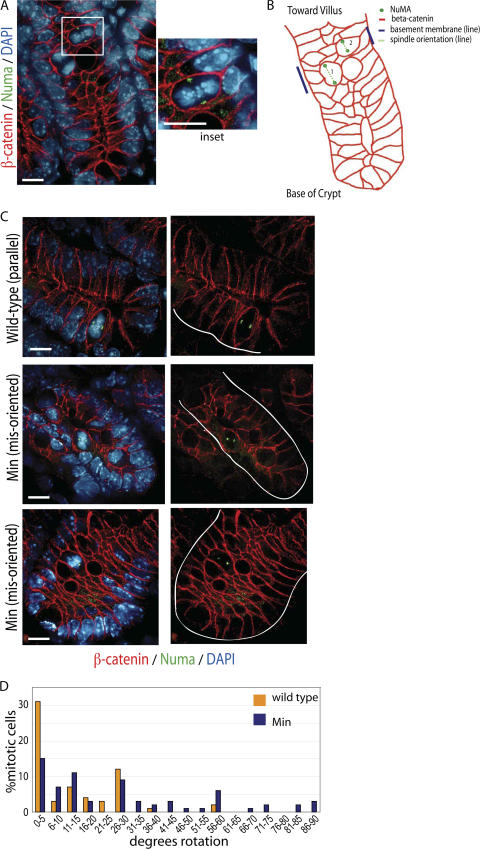
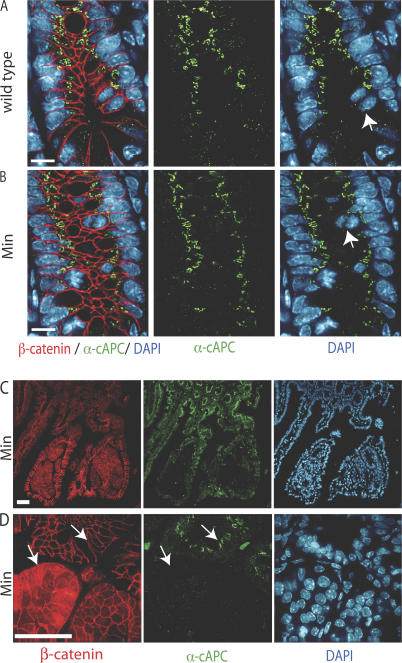
Previous research has proposed that genomic instability contributes to cancer progression, with its initiation linked to tetraploid cell formation (Duesberg, P., and R. Li. 2003. Cell Cycle. 2:202-210; Ganem, N.J., Z. Storchova, and D. Pellman. 2007. Curr. Opin. Genet. Dev. 17:157-162). However, there is little direct evidence linking cancer-causing mutations with such events, and it remains controversial whether genomic instability is a cause or an effect of cancer. In this study, we show that adenomatous polyposis coli (APC) mutations found in human colorectal cancers dominantly inhibit cytokinesis by preventing mitotic spindle anchoring at the anaphase cortex and, thus, blocking initiation of the cytokinetic furrow. We find that dividing crypt cells in the small intestines of APC(Min/+) mice exhibit similar mitotic defects, including misoriented spindles and misaligned chromosomes. These defects are observed in normal crypt cells with wild-type levels of beta-catenin and, importantly, are associated with tetraploid genotypes. We provide direct evidence that the dominant activity of APC mutants induces aneuploidy in vivo. Our data support a model whereby tetraploid cells represent a first step in the onset of genomic instability and colorectal cancer.


Figures

Figure 1.
Figure 1.
Expression of APC1–1,450 results in the accumulation of binucleate and multinucleate cells. (A) Cells were fixed and stained with DAPI to visualize normal, binucleate, and multinucleate cells. (B) The percentage of control cells or cells expressing APC1–1,450 with more than one nuclei were determined after fixing and staining cells to visualize chromosomes 0, 2, 4, 6, 8, and 10 d after induction. The percentage of cells that were binucleate (orange) or multinucleate (purple) were calculated for a minimum of 300 cells. The data presented are representative of three separate experiments performed at different time intervals. The range of multinucleated cells observed for all experiments is presented in Table I. DIC, differential interference contrast. Bars, 10 μm.
Figure 2.
Figure 2.
Expression of APC1–1,450 results in cytokinetic failure. (A–D) EYFP–H2B was transiently expressed in the indicated cell lines. Metaphase cells were filmed, and select time points from videos (Videos 1 and 2, available at http://www.jcb.org/cgi/content/full/jcb.200703186/DC1) were formatted to show fluorescence (A and C) or the fluorescence images overlaid with brightfield images (B and D). Images were recorded every minute; time 0 was set as the last time point before anaphase onset. The arrow in B indicates furrow ingression, and a corresponding arrow in D shows the lack of change at the cortex at the same time point after anaphase begins.
Figure 3.
Figure 3.
Spindle anchoring is critical for cytokinesis. (A) Representative images from videos of the indicated cell lines cotransformed with EB1-GFP (complete videos can be found as Videos 3 and 4, available at http://www.jcb.org/cgi/content/full/jcb.200703186/DC1). Arrows indicate cortical EB1 comets found at the plus ends of microtubules. (B–E) Time points from videos of the indicated cell lines expressing tubulin-GFP are shown (t was set to 0 at the start of filming; complete videos can be found as Videos 5, 6, and 7 corresponding to B, C, and D, respectively). The two examples of cells expressing APC1–1,450 include one example of an unsuccessful cytokinesis (APC1–1,450a) and one of a successful cytokinesis (APC1–1,450b). Spindle histories are presented to the right of each time series. In brief, the cortex of the cell in each video frame was outlined with a circle, and the spindle position was marked with a line. A red line was used to indicate spindles that rotated out of the plane of focus or back into the plane of focus and, thus, could not be represented on the two-dimensional diagram. (F) A stable 293 cell line expressing APC58–1,450 was transfected with enhanced GFP–H2B and filmed from metaphase through the completion of cytokinesis. The arrow at the 15-min time point indicates furrow ingression (chromosomes are compressed) in the presence of lagging chromosomes. (G) 68 videos of each cell line expressing either tubulin-GFP, EB1-GFP, or EYFP-H2B were analyzed for spindle anchoring (<15° rotation between 2-min time points), initiation of anaphase (spindle elongation or chromosome separation), and initiation of a cleavage furrow as judged by ingression at the equatorial cortex. Bars, 10 μm.
Figure 4.
Figure 4.
Min mice have mitotic defects in dividing crypt cells. (A) Crypts in the small intestine were analyzed using fluorescence microscopy. The cellular boundaries were identified with β-catenin (red), spindles with Numa antibodies (green), and chromosomes with DAPI (blue); a twofold magnification of the boxed area is shown in the inset. (B) Diagram of the cellular organization, position of mitotic cells, and orientation of their spindles for a wild-type mouse. The dark blue line indicates the position of the basement membrane, and the dashed green line shows the orientation of the spindle. (C) Small intestine crypts stained as in A from wild-type and Min mice (two examples) showing parallel and misoriented mitotic spindles, respectively. (D) Orientation of the mitotic spindle with respect to the basement membrane was determined for >100 mitoses from wild-type and Min mice. The rotational angles were separated into 5° increments, and the frequency of spindles in each category was plotted. Bars, 10 μm.
Figure 5.
Figure 5.
Mitotic defects occur in histologically normal crypts. (A and B) Intestinal crypts from wild-type (A) and Min (B) mice were stained with β-catenin (red), an antibody to the C-terminal portion of APC (detects wild-type full-length APC but not truncated APC; see Fig. S5, A and B; available at http://www.jcb.org/cgi/content/full/jcb.200703186/DC1), and DAPI (blue). Arrows indicate the positions of mitotic cells. (C) Low magnification image of dysplastic regions of the intestine stained as in A. (D) High magnification image of dysplastic regions stained as in A. The arrows highlight normal β-catenin levels in cells with wild-type APC and elevated β-catenin levels in cells that have lost wild-type APC. Bars, 10 μm.
Figure 6.
Figure 6.
Min mice have an accumulation of tetraploid cells and exhibit tetraploid cells in the small intestine. To determine the ploidy of individual cells in the small intestine, FISH was performed using a probe against chromosome 8. (A–F) A micrograph of a representative cross section from an intestinal crypt is shown with FISH (green) and DAPI (blue) counterstain (A), FISH and FM4-64 (red) membrane counterstain (B), or a merge of FISH, DAPI, and FM4-64 staining (C). The areas indicated by the boxes in C are magnified 2.5-fold and provide examples of a normal diploid cell (D), a G2 cell with four FISH signals (E), and a tetraploid cell (F). (G and H) Min cells with tetrapolar spindle poles in metaphase were visualized using antibodies to Numa (green). Cell boundaries are demarked by β-catenin staining (red), and chromosomes are stained with DAPI. Bars, 10 μm.
Figure 7.
Figure 7.
A model for a transient tetraploid intermediate in cancer progression. (A) The diagram outlines how genetic lesions or changes caused by environmental stress could, in principle, give rise to mitotic defects and tetraploid cells. Such transient tetraploid cells must resolve their extra centrosomes and large chromosome number to proceed. A strong selection occurs for cells that achieve a balance of structural and numerical changes in chromosomes that favor fitness over inviability and give rise to nascent tumor cells. (B) The data presented in this study are in red, which support the corresponding proposed steps in the model shown in A. The numbers of tetraploid cells and dysplastic regions are reported in this study, whereas the numbers of adenomas are the mean/Min heterozygote reported by Moser et al. (1990).

Similar articles

Cited by

References

    1. Alsop, G.B., and D. Zhang. 2003. Microtubules are the only structural constituent of the spindle apparatus required for induction of cell cleavage. J. Cell Biol. 162:383–390. - PMC - PubMed
    1. Cardoso, J., L. Molenaar, R.X. de Menezes, M. van Leerdam, C. Rosenberg, G. Moslein, J. Sampson, H. Morreau, J.M. Boer, and R. Fodde. 2006. Chromosomal instability in MYH- and APC-mutant adenomatous polyps. Cancer Res. 66:2514–2519. - PubMed
    1. D'Avino, P.P., M.S. Savoian, and D.M. Glover. 2005. Cleavage furrow formation and ingression during animal cytokinesis: a microtubule legacy. J. Cell Sci. 118:1549–1558. - PubMed
    1. Draviam, V.M., I. Shapiro, B. Aldridge, and P.K. Sorger. 2006. Misorientation and reduced stretching of aligned sister kinetochores promote chromosome missegregation in EB1- or APC-depleted cells. EMBO J. 25:2814–2827. - PMC - PubMed
    1. Duesberg, P., and R. Li. 2003. Multistep carcinogenesis: a chain reaction of aneuploidizations. Cell Cycle. 2:202–210. - PubMed

Publication types

Substances