. 2007 Dec;27(23):8098-112.
doi: 10.1128/MCB.00756-07. Epub 2007 Sep 24.

Serum withdrawal-induced accumulation of phosphoinositide 3-kinase lipids in differentiating 3T3-L6 myoblasts: distinct roles for Ship2 and PTEN

Affiliations

Serum withdrawal-induced accumulation of phosphoinositide 3-kinase lipids in differentiating 3T3-L6 myoblasts: distinct roles for Ship2 and PTEN

Adel Mandl et al. Mol Cell Biol. 2007 Dec.

Abstract

Phosphoinositide 3-kinase (PI3K) activation and synthesis of phosphatidylinositol-3,4-bisphosphate (PI-3,4-P2) and phosphatidylinositol-3,4,5-trisphosphate (PI-3,4,5-P3) lipids mediate growth factor signaling that leads to cell proliferation, migration, and survival. PI3K-dependent activation of Akt is critical for myoblast differentiation induced by serum withdrawal, suggesting that in these cells PI3K signaling is activated in an unconventional manner. Here we investigate the mechanisms by which PI3K signaling and Akt are regulated during myogenesis. We report that PI-3,4-P2 and PI-3,4,5-P3 accumulated in the plasma membranes of serum-starved 3T3-L6 myoblasts due to de novo synthesis and increased lipid stability. Surprisingly, only newly synthesized lipids were capable of activating Akt. Knockdown of the lipid phosphatase PTEN moderately increased PI3K lipids but significantly increased Akt phosphorylation and promoted myoblast differentiation. Knockdown of the lipid phosphatase Ship2, on the other hand, dramatically increased the steady-state levels of PI-3,4,5-P3 but did not affect Akt phosphorylation and increased apoptotic cell death. Together, these results reveal the existence of two distinct pools of PI3K lipids in differentiating 3T3-L6 myoblasts: a pool of nascent lipids that is mainly dephosphorylated by PTEN and is capable of activating Akt and promoting myoblast differentiation and a stable pool that is dephosphorylated by Ship2 and is unable to activate Akt.


Figures
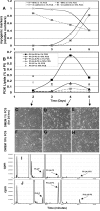
FIG. 1.
FIG. 1.
Changes in PI-3,4-P2 and PI-3,4,5-P3 levels during 3T3-L6 myoblast differentiation. Cells were seeded at a low density (10% confluence) and maintained in medium supplemented with 10% FCS. Twenty-four hours prior to harvesting the lipids or proteins, the medium was changed to DMEM containing 10% FCS (dashed lines) or 1% FCS (solid black lines), supplemented with [3H]inositol (B, I, and J). (A) The expression of the myogenic markers m-cadherin and MHC during the course of 3T3-L6 differentiation was determined by Western blot analysis. (B) The levels of PI-3,4-P2 (squares) and PI-3,4,5-P3 (triangles) in differentiating 3T3-L6 myoblasts were measured by HPLC analysis after metabolic labeling of the cells for 24 h. Also shown are the levels of PI-3-P in cells labeled in medium containing 10% FCS or 1% FCS. (C to H) Phase-contrast microscopy photos of the 3T3-L6 cultures in medium containing 1% FCS (C to E) or 10% FCS (F to H), before cells were collected at day 2 (C and F), day 4 (D and G), or day 5 (E and H). (I and J) HPLC profile of the deacylated phosphoinositides in 3T3-L6 cells labeled for 24 h with [3H]inositol in medium containing 10% FCS (I) or 1% FCS (J) on day 4 of differentiation. The data shown are representative of more than three independent measurements.
FIG. 2.
FIG. 2.
Effects of serum withdrawal and insulin stimulation on the stability of phosphoinositides (PI) and on phospho-Akt levels. (A) 3T3-L6 cells were kept in medium containing 10% FCS (gray symbols) or serum starved in medium containing 1% FCS (black symbols). Twenty-four hours after serum withdrawal, the cells were labeled with 32P for 2 h and then treated with wortmannin (100 nM) for 15 or 30 min or not treated, as indicated. The levels of deacylated PI-3-P (circles) and PI-3,4,5-P3 (triangles) were measured after HPLC separation and normalized against total phosphoinositide phosphate levels. After 2 h of 32P labeling, the levels of [32P]PI-3,4,5-P3 present in serum-starved cells (time zero) were similar to the levels present in non-serum-starved cells. (B) 3T3-L6 cells were labeled with [3H]inositol for 24 h in medium containing 1% FCS and treated with 100 nM wortmannin or not treated for the indicated times, and the levels of deacylated PI-3-P (circles), PI-3,4-P2 (squares), and PI-3,4,5-P3 (triangles) were measured after HPLC separation. Phospho-Akt levels (diamonds) and phospho-Erk1 (stars) in serum-starved cells (1% FCS) treated with 100 nM wortmannin or not treated were measured by Western blotting using anti-pS473 and anti-pErk antibodies. The data shown are representative of more than three independent measurements. (C) 3T3-L6 cells were labeled with [3H]inositol in medium containing 10%, 1%, or 0.1% FCS, and the levels of deacylated PI-3-P, PI-3,4-P2, and PI-3,4,5-P3 were measured after HPLC separation. Phospho-Akt (pAkt) levels were measured by Western blotting, using protein lysates prepared from cells kept under conditions similar to those used for lipid labeling and anti-pS473 antibody. The relative data, normalized against the cells kept in 10% FCS, were plotted in a direct (y axis) and inverse (x axis) logarithmic scale and show the averages ± standard errors (error bars) for three independent experiments. (D) Cells were labeled as described above for panel B, treated with insulin (10 nM) or not treated for 1 min (PI measurements) or 5 min (phospho-Akt measurements), before treatment with wortmannin (white symbols) or DMSO (black symbols) for the time indicated. Time zero indicates the time when wortmannin was added. Time −5 indicates the basal levels of phospho-Akt, and time −1 indicates the basal levels of PI3K lipids. Data were plotted relative to the levels of PIs and phospho-Akt at time zero.
FIG. 3.
FIG. 3.
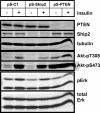
RNAi knockdown of Ship2 and PTEN in 3T3-L6 cells. The expression of PTEN and Ship2 in 3T3-L6 cells infected with the pSuper-derived retrovirus pS-C1, pS-Ship2, or pS-PTEN were measured by Western blotting using PTEN- and Ship2-specific antibodies, as indicated. Akt and Erk phosphorylation were also determined by Western blotting using phospho-specific antibodies. Protein lysates were prepared from serum-starved 3T3-L6 cells, treated with insulin (10 nM) for 10 min (+) or not treated with insulin (−). Antitubulin or anti-Erk antibodies were used as loading controls. Blots shown are representative of more than 10 separate experiments and separate infections. Akt-pT308, Akt with phosphorylated Thr308; pErk, phosphorylated Erk.
FIG. 4.
FIG. 4.
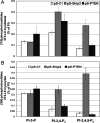
Effects of Ship2 or PTEN knockdown on the steady-state level of phosphoinositide in 3T3-L6 myoblasts and myocytes. Phosphoinositide levels in 3T3-L6 cells infected with pS-C1, pS-Ship2, or pS-PTEN retrovirus were measured in myoblasts (A) or myocytes (B) labeled with [3H]inositol for 48 h in 0.1% or 2% FCS, respectively. The data in panel A represent the averages ± standard errors (error bars) of 5 (control), 10 (Ship2), and 4 (PTEN) independent measurements. The data in panel B represent the average (bars) and range (error bars) for the values from two separate experiments.
FIG. 5.
FIG. 5.
Effects of Ship2 or PTEN knockdown on basal and insulin-stimulated PI3K lipids and phospho-Akt. (A and B) The levels of PI-3-P, PI-3,4-P2, and PI-3,4,5-P3 in 3T3-L6 cells infected with pS-C1, pS-Ship2, or pS-PTEN were measured in cells serum starved for 24 h, labeled with 32P for 4 h, and stimulated with 10 nM insulin for 10 min (B) or not stimulated with insulin (A). PIPs, phosphoinositide phosphates. (C and D) Phospho-S473 (C) and phospho-T308 (D) levels in 3T3-L6 cells infected with pS-C1, pS-Ship2, or pS-PTEN, serum starved for 24 h, and stimulated with insulin (10 nM) for 10 min or not stimulated with insulin were measured by Western blotting using phospho-specific antibodies. Data shown are the averages ± standard errors (error bars) for six experiments (for Akt with phosphorylated Ser473 [pS473-Akt]) and four experiments (for Akt with phosphorylated Thr308 [pT308-Akt]).
FIG. 6.
FIG. 6.
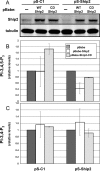
Reexpression of wild-type and catalytic-dead Ship2 in Ship2 knockdown cells. (A) Expression of Ship2 was measured by Western blotting using anti-Ship2 antibody after 3T3-L6 cells infected with pS-C1 or pS-Ship2 were reinfected with empty pBabe virus (−) or pBabe virus carrying the sequence for RNAi-insensitive wild-type (WT) or catalytic-dead (CD) Ship2, as indicated. (B and C) PI-3,4,5-P3 (B) and PI-3,4-P2 (C) levels in 3T3-L6 cells expressing RNAi-insensitive wild-type Ship2 (pBabe-Ship2), catalytic-dead Ship2 (pBabe-Ship2-CD), or empty vector (pBabe) were measured by labeling the cells for 48 h with [3H]inositol in medium containing 0.1% FCS. Phosphoinositide levels were plotted relative to the levels in the control cells (cells infected with empty pBabe virus). The results shown are the averages ± standard errors (error bars) obtained from two independent experiments.
FIG. 7.
FIG. 7.
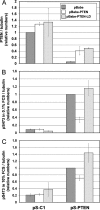
Reexpression of wild-type and lipid phosphatase-dead PTEN in PTEN knockdown cells. Expression of PTEN (A) or Akt phosphorylation (B and C) was measured by Western blotting using anti-PTEN antibody or anti-pS473 and lysates from cells infected with pS-C1 or pS-PTEN reinfected with the pBabe empty vector or pBabe expressing wild-type, RNAi-insensitive PTEN (pBabe-PTEN) or lipid phosphatase-dead PTEN (pBabe-PTEN-LD). The cells in panel B were serum starved for 24 h in medium supplemented with 0.1% FCS, and the cells in panel C were kept in medium supplemented with 10% FCS. Data were normalized against the data for tubulin and are averages ± standard errors (error bars) for three experiments.
FIG. 8.
FIG. 8.
Phosphoinositide levels and Akt phosphorylation in Ship2 and PTEN double-knockdown cells. (A) Phospho-Akt, Ship2, and PTEN levels in 3T3-L6 cells infected with pSuper and pReSI vectors to generate single and double-knockdown cells were measured by Western blotting using anti-pS473, anti-Ship2, and anti-PTEN antibodies, as indicated. (B) Phospho-Akt levels from three independent experiments were quantified, normalized against tubulin data, and plotted relative to the PTEN knockdown values. pS473-Akt, Akt with phosphorylated Ser473. (C to F) The levels of PI-3,4-P2 (C and E) and PI-3,4,5-P3 (D and F) in [3H]inositol-labeled 3T3-L6 cells were measured after HPLC separation of the deacylated lipids and normalized against phosphatidylinositol (PI). The cells in panels C and D were labeled for 48 h in medium containing 0.1% FCS. Results shown represent the averages plus standard errors (error bars) of three separate experiments. (E and F) pS-C1/pReSI-C1-infected cells (C1 C1) or pS-PTEN/pReSI-Ship2 cells (PTEN Ship2) were labeled for 24 h in medium containing either 10% FCS or 1% FCS.
FIG. 9.
FIG. 9.
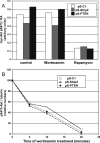
Effect of Ship2 or PTEN knockdown on PDK2 activity and on Akt dephosphorylation rate. (A) Phosphorylation of myr-Akt at S473 in pS-C1-, pS-Ship2-, and pS-PTEN-infected 3T3-L6 cells was measured by Western blotting of anti-HA immunoprecipitates with phospho-S473 antibody. Cells were transiently transfected with HA-myr-Akt and treated with rapamycin for 24 h or with wortmannin for 30 min or left untreated (control). The pS473 band was quantified and normalized against total HA. The data shown are representative of three experiments. (B) Dephosphorylation of Akt at S473 was measured by Western blotting of total lysates from 3T3-L6 cells infected with pS-C1, pS-Ship2, or pS-PTEN, maintained in 10% FCS, and treated with wortmannin for 5, 10 and 20 min or not treated, as indicated. The data shown represent the quantification of the pS473 bands, normalized against tubulin data and plotted relative to the values for untreated cells. Data are representative of two experiments.
FIG. 10.
FIG. 10.
Subcellular localization of GFP-PH domain, Akt, and PTEN. (a to g) Confocal microscopy of 3T3-L6 cells transiently expressing the GFP-PH domain of Akt (b) or Btk (a and c to g). After transfection, cells were serum starved for 24 h and left untreated (a to e) or treated with wortmannin for 30 min (f to g). The cells in panels d were also stained with antibody against m-cadherin, and the cells in panels e to g were stained with antibody against total Akt. (h to l) Confocal microscopy showing endogenous Akt and PTEN localization in 3T3-L6 cells, serum starved and left untreated (h and j) or treated with insulin for 10 min (i and k) or wortmannin for 30 min (l) and stained with antibodies against total Akt and m-cadherin (h) or with phospho-Akt and fluorescent phalloidin (i), total Akt and PTEN (j and l), or phospho-Akt and PTEN (k). In panels d to l, the leftmost panels (labeled with the number 1) show the red channel, the middle panels (number 2) show the green channel, and the rightmost panels (number 3) show both channels.
FIG. 11.
FIG. 11.
Effects of Ship2 and PTEN knockdowns on cells. (A) Proliferation rates of 3T3-L6 myoblasts infected with pS-C1-, pS-Ship2-, or pS-PTEN-derived retrovirus were measured in 10% FCS by counting the number of viable cells for a period of 8 days. (B) Percentages of apoptosis in 3T3-L6 myoblasts infected with pS-C1, pS-Ship2, or pS-PTEN retrovirus and kept for 48 h in 10% FCS or 0.1% FCS were measured by Western blotting using antibody against cleaved caspase 3. The results shown are the average ± standard errors (error bars) for three experiments. (C) Early differentiation rate was determined by measuring the MHC expression in myoblasts infected with pS-C1, pS-Ship2, or pS-PTEN retroviruses after 24 h in 0.1% FCS by Western blotting. The results shown are the averages of two experiments. (D) Percent differentiation of 3T3-L6 myoblasts infected with pS-C1, pS-Ship2, or pS-PTEN retroviruses was measured by counting the number of colonies that present more than 20 nuclei per myotube after 4 days in medium containing 2% FCS. One hundred colonies were counted for each cell line.

Similar articles

Cited by

References

    1. Alessi, D. R., S. R. James, C. P. Downes, A. B. Holmes, P. R. Gaffney, C. B. Reese, and P. Cohen. 1997. Characterization of a 3-phosphoinositide-dependent protein kinase which phosphorylates and activates protein kinase Balpha. Curr. Biol. 7:261-269. - PubMed
    1. Blero, D., J. Zhang, X. Pesesse, B. Payrastre, J. E. Dumont, S. Shurmans, and C. Erneux. 2005. Phosphatidylinositol 3,4,5-trisphosphate modulation in Ship2 deficient mouse embryonic fibroblast. FEBS J. 272:2512-2522. - PubMed
    1. Bradford, M. M. 1976. A rapid and sensitive method for the quantitation of microgram quantities of protein utilizing the principle of protein-dye binding. Anal. Biochem. 72:248-254. - PubMed
    1. Cantley, L. C. 2002. The phosphoinositide 3-kinase pathway. Science 296:1655-1657. - PubMed
    1. Clement, S., U. Krause, F. Desmedt, J. F. Tanti, J. Behrends, X. Pesesse, T. Sasaki, J. Penninger, M. Doherty, W. Malaisse, J. E. Dumont, Y. Le Marchand-Brustel, C. Erneux, L. Hue, and S. Schurmans. 2001. The lipid phosphatase SHIP2 controls insulin sensitivity. Nature 409:92-97. - PubMed

Publication types

MeSH terms

Substances