

Gene expression fluctuations in murine hematopoietic stem cells with cell cycle progression
- PMID: 17894410
- PMCID: PMC4286177
- DOI: 10.1002/jcp.21273
Gene expression fluctuations in murine hematopoietic stem cells with cell cycle progression
Abstract
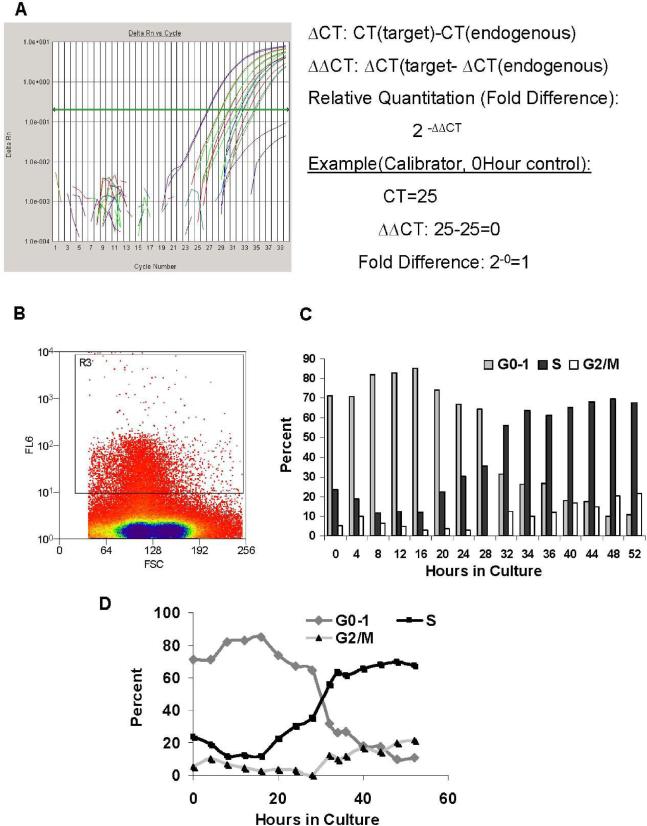
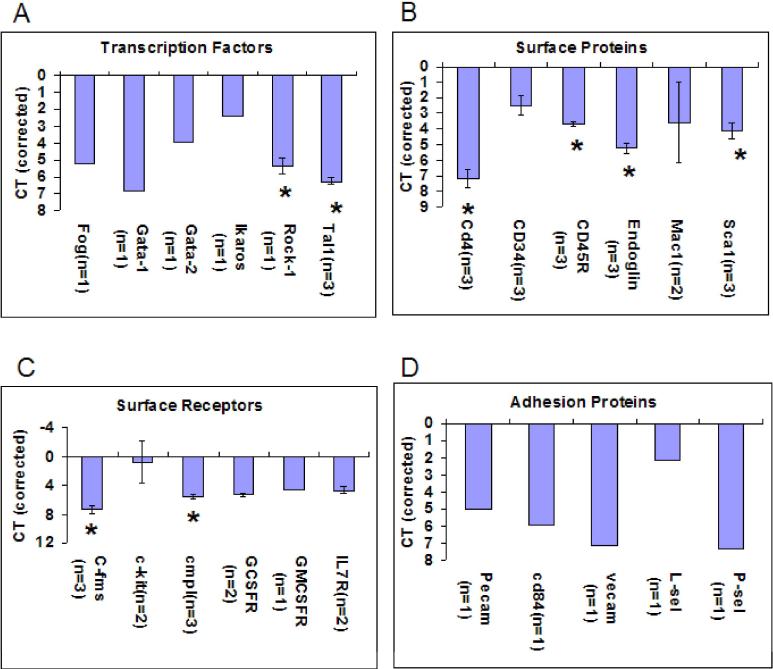
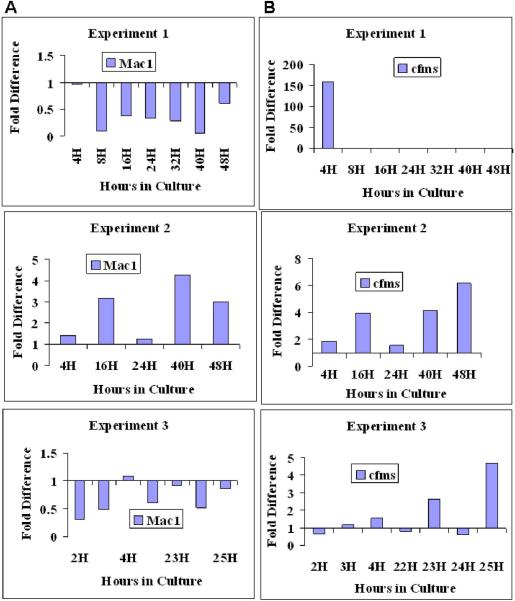
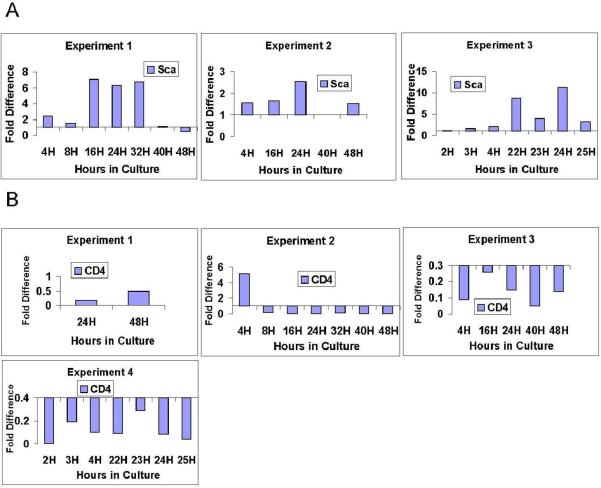
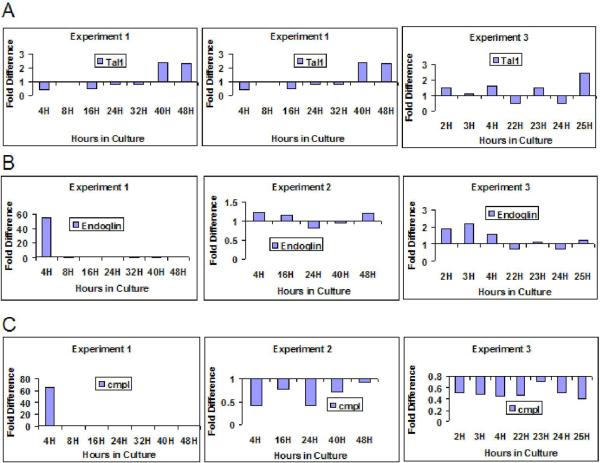
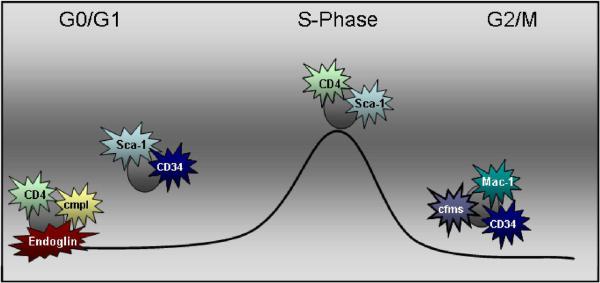
Evolving data suggest that marrow hematopoietic stem cells show reversible changes in homing, engraftment, and differentiation phenotype with cell cycle progression. Furthermore, marrow stem cells are a cycling population. Traditional concepts hold that the system is hierarchical, but the information on the lability of phenotype with cycle progression suggests a model in which stem cells are on a reversible continuum. Here we have investigated mRNA expression in murine lineage negative stem cell antigen-1 positive stem cells of a variety of cell surface epitopes and transcription regulators associated with stem cell identity or regulation. At isolation these stem cells expressed almost all cell surface markers, and transcription factors studied, including receptors for G-CSF, GM-CSF, and IL-7. When these stem cells were induced to transit cell cycle in vitro by exposure to interleukin-3 (IL-3), Il-6, IL-11, and steel factor some (CD34, CD45R c-kit, Gata-1, Gata-2, Ikaros, and Fog) showed stable expression over time, despite previously documented alterations in phenotype, while others showed variation of expression between and within experiments. These latter included Sca-1, Mac-1, c-fms, and c-mpl. Tal-1, endoglin, and CD4. These studies indicate that defined marrow stem cells express a wide variety of genes at isolation and with cytokine induced cell cycle transit show marked and reversible phenotype lability. Altogether, the phenotypic plasticity of gene expression for murine stem cells indicates a continuum model of stem cell regulation and extends the model to reversible expression with cell cycle transit of mRNA for cytokine receptors and stem cell markers.
(c) 2007 Wiley-Liss, Inc.
Figures

Similar articles
-
The stem cell continuum: cell cycle, injury, and phenotype lability.Ann N Y Acad Sci. 2007 Jun;1106:20-9. doi: 10.1196/annals.1392.016. Epub 2007 Mar 14. Ann N Y Acad Sci. 2007. PMID: 17360803 Review.
-
Marrow stem cells shift gene expression and engraftment phenotype with cell cycle transit.J Exp Med. 2003 Jun 2;197(11):1563-72. doi: 10.1084/jem.20030031. J Exp Med. 2003. PMID: 12782718 Free PMC article.
-
Adhesion receptor expression by hematopoietic cell lines and murine progenitors: modulation by cytokines and cell cycle status.Exp Hematol. 1999 Mar;27(3):533-41. doi: 10.1016/s0301-472x(98)00037-x. Exp Hematol. 1999. PMID: 10089917
-
The fluctuating phenotype of the lymphohematopoietic stem cell with cell cycle transit.J Exp Med. 1998 Jul 20;188(2):393-8. doi: 10.1084/jem.188.2.393. J Exp Med. 1998. PMID: 9670051 Free PMC article.
-
Physical and physiological plasticity of hematopoietic stem cells.Blood Cells Mol Dis. 2001 Sep-Oct;27(5):934-7. doi: 10.1006/bcmd.2001.0460. Blood Cells Mol Dis. 2001. PMID: 11783958 Review.
Cited by
-
The universal stem cell.Leukemia. 2022 Dec;36(12):2784-2792. doi: 10.1038/s41375-022-01715-w. Epub 2022 Oct 28. Leukemia. 2022. PMID: 36307485 Free PMC article. Review.
-
Marrow Hematopoietic Stem Cells Revisited: They Exist in a Continuum and are Not Defined by Standard Purification Approaches; Then There are the Microvesicles.Front Oncol. 2014 Apr 4;4:56. doi: 10.3389/fonc.2014.00056. eCollection 2014. Front Oncol. 2014. PMID: 24772390 Free PMC article. Review.
-
Progenitor/stem cell fate determination: interactive dynamics of cell cycle and microvesicles.Stem Cells Dev. 2012 Jul 1;21(10):1627-38. doi: 10.1089/scd.2011.0550. Epub 2012 Feb 15. Stem Cells Dev. 2012. PMID: 22214238 Free PMC article.
-
Expression of cell cycle-related genes with cytokine-induced cell cycle progression of primitive hematopoietic stem cells.Stem Cells Dev. 2010 Apr;19(4):453-60. doi: 10.1089/scd.2009.0283. Stem Cells Dev. 2010. PMID: 19788373 Free PMC article.
-
To breathe or not to breathe: the haematopoietic stem/progenitor cells dilemma.Br J Pharmacol. 2013 Aug;169(8):1652-71. doi: 10.1111/bph.12253. Br J Pharmacol. 2013. PMID: 23714011 Free PMC article. Review.
References
-
- Cantor AB, Orkin SH. Hematopoietic development: a balancing act. Curr Opin Genet Dev. 2001;11:513–519. - PubMed
-
- Quesenberry PJ, Colvin GA, Lambert JF. The chiaroscuro stem cell: A unified stem cell theory. Perspective, Blood. 2002;100:4266–4271. - PubMed
-
- Quesenberry PJ, Colvin GA, Abedi M, Cerny J, Dooner M, Moore B, McAuliffe C, Demers D, Greer D, Parent A, Badiavas E, Lum L, Falanga V. The Marrow Stem Cell: The Continuum. Bone Marrow Transplantation. 2003;32:S19–22. - PubMed
-
- Quesenberry PJ, Dooner G, Dooner M, Colvin G. The Stem Cell Continuum: Considerations on the Heterogeneity and Plasticity of Marrow Stem Cells. Stem Cell. 2004 Review. - PubMed
-
- Quesenberry PJ. The continuum model of stem cell regulation. Curr Opin Hematol. 2006;13:216–221. - PubMed
Publication types
MeSH terms
Substances
Grants and funding
LinkOut - more resources
Full Text Sources
Medical
Research Materials
Miscellaneous
