Comparative Study
. 2007 Sep 25:8:340.
doi: 10.1186/1471-2164-8-340.

Comparison of the contributions of the nuclear and cytoplasmic compartments to global gene expression in human cells

Affiliations
Comparative Study

Comparison of the contributions of the nuclear and cytoplasmic compartments to global gene expression in human cells

Roger A Barthelson et al. BMC Genomics. .

Abstract

Background: In the most general sense, studies involving global analysis of gene expression aim to provide a comprehensive catalog of the components involved in the production of recognizable cellular phenotypes. These studies are often limited by the available technologies. One technology, based on microarrays, categorizes gene expression in terms of the abundance of RNA transcripts, and typically employs RNA prepared from whole cells, where cytoplasmic RNA predominates.

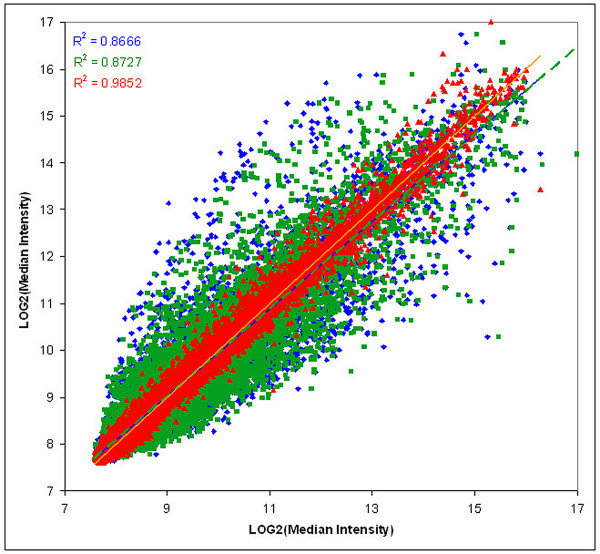
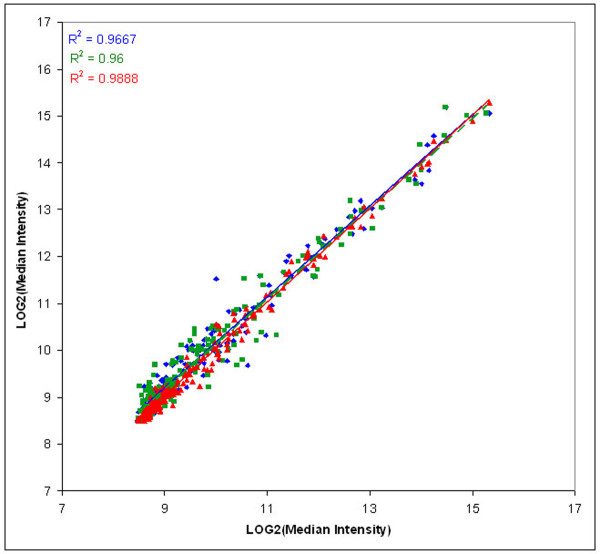
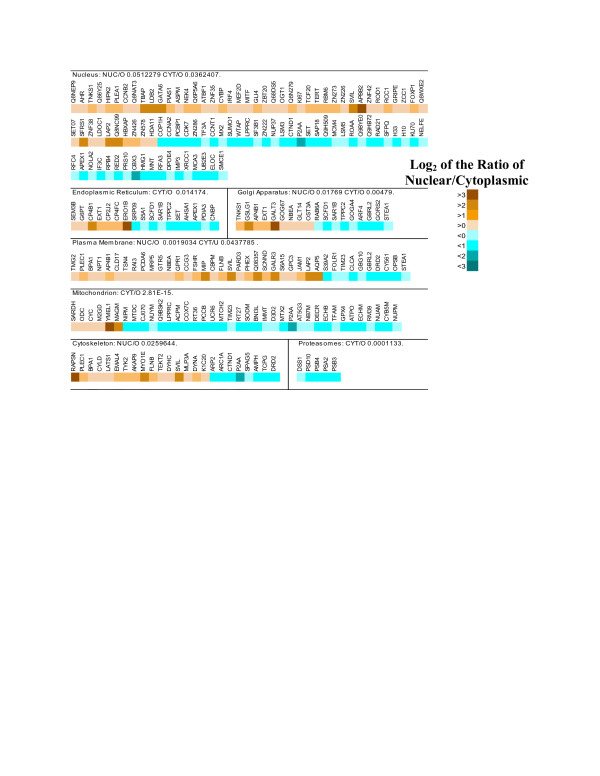
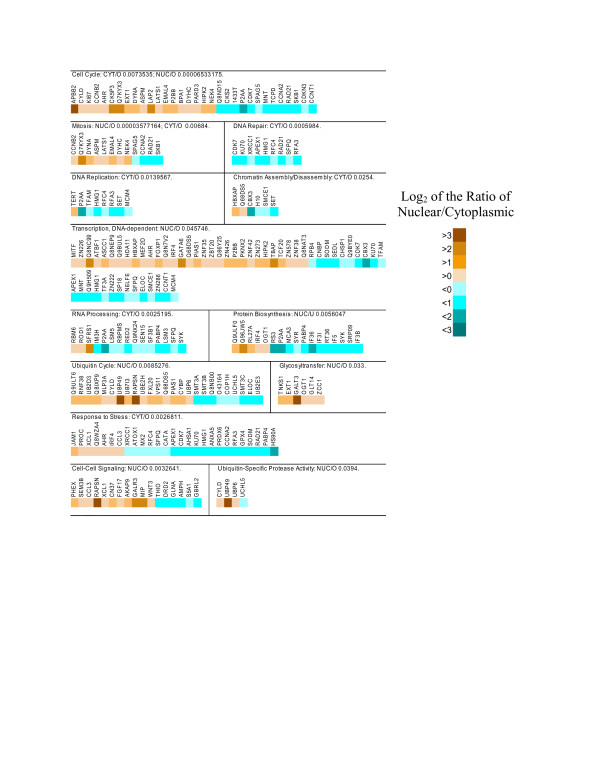
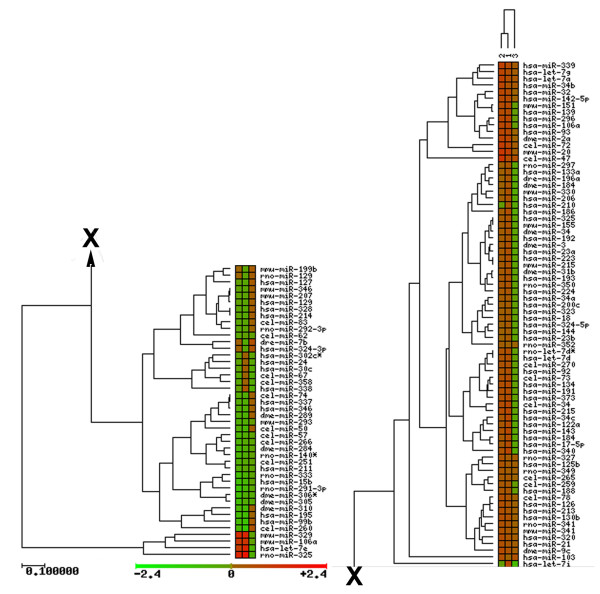
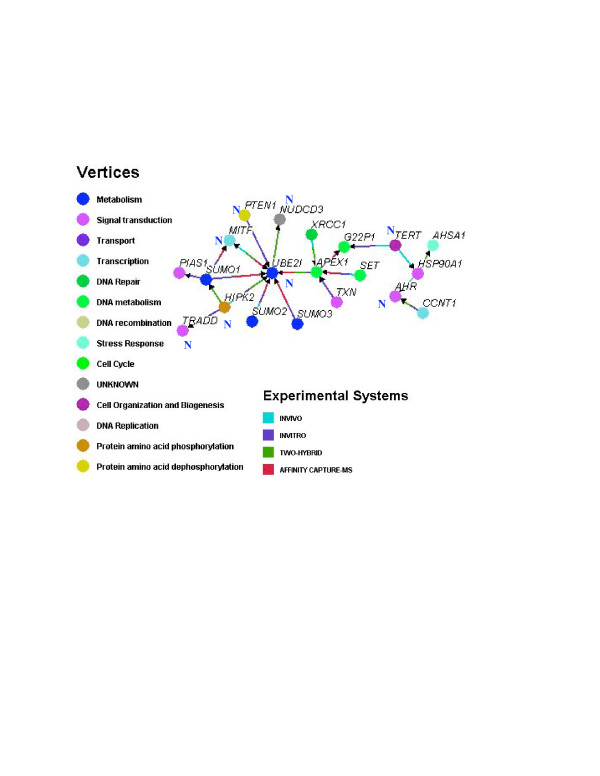
Results: Using microarrays comprising oligonucleotide probes that represent either protein-coding transcripts or microRNAs (miRNA), we have studied global transcript accumulation patterns for the HepG2 (human hepatoma) cell line. Through subdividing the total pool of RNA transcripts into samples from nuclei, the cytoplasm, and whole cells, we determined the degree of correlation of these patterns across these different subcellular locations. The transcript and miRNA abundance patterns for the three RNA fractions were largely similar, but with some exceptions: nuclear RNA samples were enriched with respect to the cytoplasm in transcripts encoding proteins associated with specific nuclear functions, such as the cell cycle, mitosis, and transcription. The cytoplasmic RNA fraction also was enriched, when compared to the nucleus, in transcripts for proteins related to specific nuclear functions, including the cell cycle, DNA replication, and DNA repair. Some transcripts related to the ubiquitin cycle, and transcripts for various membrane proteins were sorted into either the nuclear or cytoplasmic fractions.

Conclusion: Enrichment or compartmentalization of cell cycle and ubiquitin cycle transcripts within the nucleus may be related to the regulation of their expression, by preventing their translation to proteins. In this way, these cellular functions may be tightly controlled by regulating the release of mRNA from the nucleus and thereby the expression of key rate limiting steps in these pathways. Many miRNA precursors were also enriched in the nuclear samples, with significantly fewer being enriched in the cytoplasm. Studies of mRNA localization will help to clarify the roles RNA processing and transport play in the regulation of cellular function.


Figures

Figure 1
Figure 1
Human genomic microarrays: a comparison of intensity values for nuclear, cytoplasmic, and total RNA samples. The median intensity values from the hybridization of amplified RNA samples to the 70-mer probes on the human genomic microarrays were log-transformed and normalized. The least-squares mean log values from the mixed model ANOVA were plotted against each other to view the relative intensities for the following samples: Blue, nuclear (ordinate) versus cytoplasmic (abscissa) RNA; Green, nuclear (ordinate) versus total (abscissa) RNA; and Red, total (ordinate) versus cytoplasmic (abscissa) RNA. A least squares regression line was fitted to each set of points to visually demonstrate the linear relationship; the associated correlation coefficients are presented in colors that match the lines and the data points.
Figure 2
Figure 2
MicroRNA microarrays: a comparison of intensity values for nuclear, cytoplasmic, and total RNA samples. Sense DNA (reverse-transcribed, amplified RNA) samples were hybridized to the oligo probes (doublets of 18–22 nucleotides) on the MirMax miRNA microarrays. Hybridization of these samples to the miRNA arrays indicates the concentration of pri-miRNA in the RNA samples. The resulting intensity values were analyzed as given in Figure 1, and plotted with the same color key. A least squares regression line was fitted to each set of points to visually demonstrate the linear relationship; the associated correlation coefficients are presented in colors that match the lines and the data points.
Figure 3
Figure 3
GO cell component analysis of nucleus-enriched and cytoplasm-enriched transcripts. The lists of nucleus-enriched (relative to cytoplasm) and cytoplasm-enriched (relative to nucleus) transcripts were calculated for the human genomic microarray data by ANOVA and by selection of those with a FDR less than 0.05. These two lists were submitted independently for analysis by GOToolbox [27] to determine the cell component annotation of the transcripts, and to determine whether some of the annotation categories were overrepresented on the lists, using the hypergeometric test with Benjamini and Hochberg FDR calculation. Some of the categories with strong representation among the transcripts are presented here. The transcripts that were placed in each category are identified by gene name or abbreviated TREMBL identifier and color-coded to indicate the ratio of the log, mean, normalized intensity values of the nuclear sample over the cytoplasmic sample. Where the lists for nuclear or cytoplasmic transcripts show overrepresentation in a GO category, the FDR is provided.
Figure 4
Figure 4
GO biological process analysis of nucleus-enriched and cytoplasm-enriched transcripts. Details are the same as for Figure 3, except the lists of transcripts were annotated using the biological process categories.
Figure 5
Figure 5
Cluster analysis of the miRNA primary transcripts identified in the nuclear, total, and cytoplasmic fractions of the HepG2 cells. Analysis is based solely on the log ratios of the mean normalized intensity values from the hybridization of the reverse-transcribed amplified RNA samples to the miRNA microarrays. The Cluster and Treeview programs that are found on the GEPAS website [69] were used to compare 1)nuclear to cytoplasmic, 2)nuclear to total, and 3)cytoplasmic to total ratios, which are color-coded to represent the log ratios of the mean intensity values as indicated. The clustering was performed with complete linkage using the euclidean distance, and the unweighted pair group method with arithmetic averages.
Figure 6
Figure 6
The lists of nucleus-enriched and cytoplasm-enriched transcripts were analyzed for potential interactions by the proteins represented by the transcripts. The analysis was performed with Osprey software, which employs The Biogrid [49], a database of protein-protein interactions based on in vitro, in vivo, yeast two-hybrid system, and affinity-capture mass spectrometry experimentation. The main grouping of interacting proteins that resulted is presented here. Those proteins that represented nucleus-enriched transcripts are marked with an 'N'. The proteins are labeled with the corresponding gene name, and the annotation information for the proteins is provided in Table 1. Each protein is color coded according to its annotation heading. The experimental system(s) employed to determine the protein-protein relationship is indicated by the color coding of the arrows.

References

    1. Hughes TR, Marton MJ, Jones AR, Roberts CJ, Stoughton R, Armour CD, Bennett HA, Coffey E, Dai H, He YD, Kidd MJ, King AM, Meyer MR, Slade D, Lum PY, Stepaniants SB, Shoemaker DD, Gachotte D, Chakraburtty K, Simon J, Bard M, Friend SH. Functional discovery via a compendium of expression profiles. Cell. 2000;102:109–126. doi: 10.1016/S0092-8674(00)00015-5. - DOI - PubMed
    1. Moore MJ. Nuclear RNA turnover. Cell. 2002;108:431–434. doi: 10.1016/S0092-8674(02)00645-1. - DOI - PubMed
    1. Orphanides G, Reinberg D. A unified theory of gene expression. Cell. 2002;108:439–451. doi: 10.1016/S0092-8674(02)00655-4. - DOI - PubMed
    1. Kloc M, Zearfoss NR, Etkin LD. Mechanisms of subcellular mRNA localization. Cell. 2002;108:533–544. doi: 10.1016/S0092-8674(02)00651-7. - DOI - PubMed
    1. Teixeira D, Sheth U, Valencia-Sanchez MA, Brengues M, Parker R. Processing bodies require RNA for assembly and contain nontranslating mRNAs. RNA. 2005;11:371–382. doi: 10.1261/rna.7258505. - DOI - PMC - PubMed

Publication types

LinkOut - more resources