. 2007 Oct 2;104(40):15935-40.
doi: 10.1073/pnas.0707348104. Epub 2007 Sep 25.

Intensive training in adults refines A1 representations degraded in an early postnatal critical period

Affiliations

Intensive training in adults refines A1 representations degraded in an early postnatal critical period

Xiaoming Zhou et al. Proc Natl Acad Sci U S A. .

Abstract

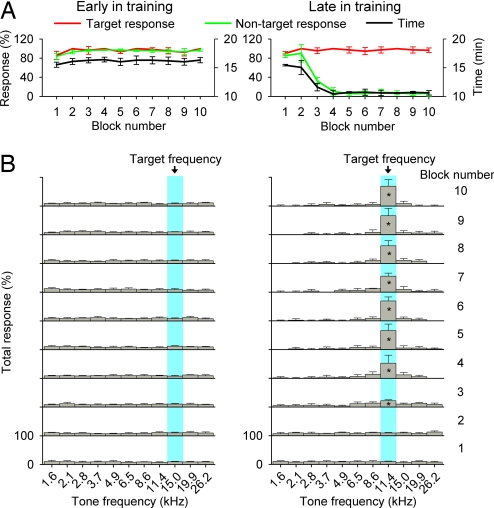
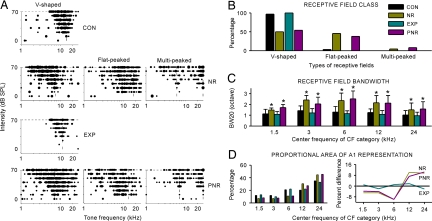
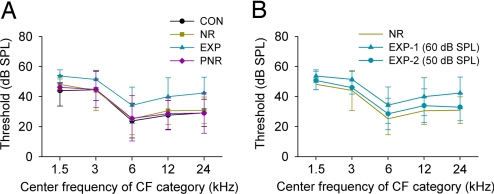
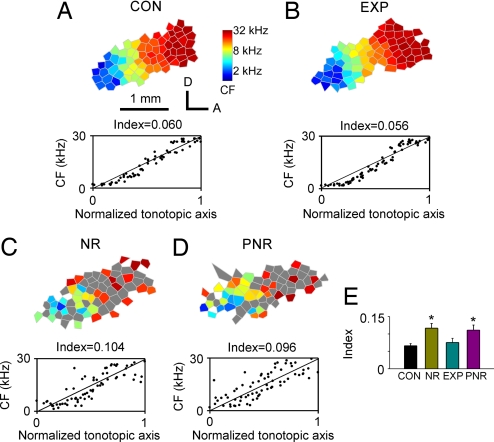
The spectral, temporal, and intensive selectivity of neurons in the adult primary auditory cortex (A1) is easily degraded in early postnatal life by raising rat pups in the presence of pulsed noise. The nonselective frequency tuning recorded in these rats substantially endures into adulthood. Here we demonstrate that perceptual training applied in these developmentally degraded postcritical-period rats results in the recovery of normal representational fidelity. By using a modified go/no-go training strategy, structured noise-reared rats were trained to identify target auditory stimuli of specific frequency from a set of distractors varying in frequency. Target stimuli changed daily on a random schedule. Consistent with earlier findings, structured noise exposure within the critical period resulted in disrupted tonotopicity within A1 and in degraded frequency-response selectivity for A1 neurons. Tonotopicity and frequency-response selectivity were normalized by perceptual training. Changes induced by training endured without loss for at least 2 months after training cessation. The results further demonstrate the potential utility of perceptual learning as a strategy for normalizing deteriorated auditory representations in older (postcritical-period) children and adults.


Conflict of interest statement

The authors declare no conflict of interest.

Figures

Fig. 1.
Fig. 1.
Behavioral performance on the frequency identification task. (A) Target and nontarget responses for each block in the early (Left) and the late (Right) training day. The time required for rats to complete each block also is shown (right ordinate). (B) Distribution of total responses for each block in the early (Left) and the late (Right) training day. All values shown are mean ± SD. *, P < 0.01 (n = 5).
Fig. 2.
Fig. 2.
Differences in neuronal response selectivity. (A) Representative examples of tonal receptive fields obtained from CON, NR, EXP, and PNR rats. Responses are represented by dots in the response area, with dot size proportional to the number of spikes evoked by tonal stimuli at each frequency and intensity. Dotted lines indicate positions of peaks of the receptive fields (marking CFs). (B) Distribution of receptive field types for all recordings obtained from four different rat groups. (C) Average receptive field BW20 for all recording sites in different groups of rats for each of five CF ranges. Values shown are mean ± SD. Bin size = 1 octave. *, P < 0.001. (D) Distribution of CF values for all recordings obtained from different groups of rats (Left) and difference functions calculated by subtracting the CF distribution in CON rats from that of NR, EXP, or PNR rats (Right). Zero values (solid black line) indicate no difference relative to the CF distribution of CON rats.
Fig. 3.
Fig. 3.
Average intensity threshold at different CF ranges for CON (n = 4), NR (n = 5), EXP (n = 5), and PNR (n = 5) rats (A) and for EXP (n = 3) rats trained using 50-dB SPL sound stimuli (B). Values shown are mean ± SD.
Fig. 4.
Fig. 4.
Topographic organization of A1. (A–D) (Upper) Representative maps illustrating the tonotopic organization within A1 recorded in CON, NR, EXP, and PNR rats. The color of each polygon indicates the CF (kHz) for neurons recorded at that site (see the scale to the right of A Upper). Polygons are Voronoi tessellations generated so that every point on the cortical surface was assumed to have the characteristics of its closest neighbors. Gray polygon in NR and PNR rats represents the flat- or multipeaked tuning curve recorded at that site. A, anterior; D, dorsal. (A–D) (Lower) Distribution of the cortical representation of different CFs along the tonotopic axis of the A1 for each example CF map. Normalized coordinates from each rat are plotted as a function of the defined CFs. Index (see Materials and Methods) of tonotopic orderliness is shown above each box. (E) Average tonotopic indices for CON, NR, EXP, and PNR rats. Values shown are mean ± SD. *, P < 0.001.
Fig. 5.
Fig. 5.
Average BW20 (A) and tonotopic index (B) of EXP rats mapped immediately after training cessation (EXP-90) or ≈60 days after training cessation (EXP-150; n = 3) illustrated with age-matched CON rats (n = 4). Values shown are mean ± SD.

Similar articles

Cited by

References

    1. Chang EF, Merzenich MM. Science. 2003;300:498–502. - PubMed
    1. Clements M, Kelly JB. Dev Psychobiol. 1978;11:505–511. - PubMed
    1. Clopton BM, Winfield JA. J Neurophysiol. 1976;39:1081–1089. - PubMed
    1. de Villers-Sidani E, Chang EF, Bao S, Merzenich MM. J Neurosci. 2007;27:180–189. - PMC - PubMed
    1. Harrison RV, Stanton SG, Ibrahim D, Nagasawa A, Mount RJ. Acta Otolaryngol. 1993;113:296–302. - PubMed

Publication types