. 2007 Sep 26;2(9):e923.
doi: 10.1371/journal.pone.0000923.

Endocytosis of DNA-Hsp65 alters the pH of the late endosome/lysosome and interferes with antigen presentation

Affiliations

Endocytosis of DNA-Hsp65 alters the pH of the late endosome/lysosome and interferes with antigen presentation

Ana Paula F Trombone et al. PLoS One. .

Abstract

Background: Experimental models using DNA vaccine has shown that this vaccine is efficient in generating humoral and cellular immune responses to a wide variety of DNA-derived antigens. Despite the progress in DNA vaccine development, the intracellular transport and fate of naked plasmid DNA in eukaryotic cells is poorly understood, and need to be clarified in order to facilitate the development of novel vectors and vaccine strategies.

Methodology and principal findings: Using confocal microscopy, we have demonstrated for the first time that after plasmid DNA uptake an inhibition of the acidification of the lysosomal compartment occurs. This lack of acidification impaired antigen presentation to CD4 T cells, but did not alter the recruitment of MyD88. The recruitment of Rab 5 and Lamp I were also altered since we were not able to co-localize plasmid DNA with Rab 5 and Lamp I in early endosomes and late endosomes/lysosomes, respectively. Furthermore, we observed that the DNA capture process in macrophages was by clathrin-mediated endocytosis. In addition, we observed that plasmid DNA remains in vesicles until it is in a juxtanuclear location, suggesting that the plasmid does not escape into the cytoplasmic compartment.

Conclusions and significance: Taken together our data suggests a novel mechanism involved in the intracellular trafficking of plasmid DNA, and opens new possibilities for the use of lower doses of plasmid DNA to regulate the immune response.


Conflict of interest statement

Competing Interests: The authors have declared that no competing interests exist.

Figures

Figure 1
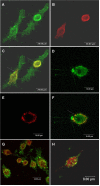
Figure 1. Visualization of plasmid DNA compartamentalization: the plasmid DNA co-localizes with transferrin in J774 cells.
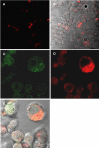
J774 cells were incubated with DNA-Alexa 488 (green) for 15 minutes (A and C) and 30 minutes (D and F). Transferrin conjugated to Alexa 594 (red) was used as marker of the early endosomes (B and E). While the plasmid DNA is colocalized with transferrin within 15 minutes (C, yellow, arrows), after 30 minutes, the plasmid DNA not was colocalized with these vesicles (F, arrow). (G–H): J774 cells were incubated with fluorescent DNA for 5 minutes (G) and 15 minutes (H); and cells immunostained for Rab5 (red), another marker of early endosomes. Plasmid DNA not was colocalized with Rab 5. Confocal images.
Figure 2
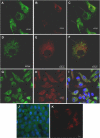
Figure 2. Intracellular trafficking of plasmid DNA.
Confocal images of J774 cells (A–F) and peritoneal macrophages (G–I) incubated with DNA-Alexa 488 (green-A, D and G) for 24 hours (A–C; G–I) and 48 hours (D–F). LysoTracker Red was used as a marker for late endosomes and lysosomes (B, E and H). Plasmid DNA was not colocalized with LysoTracker Red which had a very weak signal (C, F and I). DAPI (Molecular Probes) was used to visualize nuclei (I and J). Note that the inhibition of acidification observed was not the result of fluorocrome interference, since we use plasmid DNA without labeling and there was no labeling with LysoTracker Red (J). (J): Unlabeled plasmid DNA plus LysoTracker Green. (K): Lysotracker Red without DNA.
Figure 3
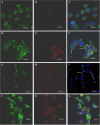
Figure 3. Intracellular trafficking of plasmid DNA.
Confocal images of J774 cells (A–I) and peritoneal macrophages (J–L) incubated with DNA-Alexa 488 (green, A, D, G and J) for 72 h (A–C; J–L), 96 h (D–F) and 120 h (G–I). The LysoTracker Red was used as a marker of late endosomes and lysosomes (B, E, H and K). Plasmid DNA did not colocalize with LysoTracker Red's weak signal (C, F, I and L), and after 96 h and 120 h, fluorescent DNA was concentrated around the nuclei (F and I). DAPI (Molecular Probes) was used to visualize nuclei (C, F, I and L). In I cells are also seen in the Z axis.
Figure 4
Figure 4. Intracellular trafficking of plasmid DNA.
Confocal images of peritoneal macrophages incubated with DNA-Alexa 488 (green, A) for 24 hours. Texas Red dextran was used as lysosomal marker (B). Plasmid DNA was incubated with dextran and significant colocalization was observed (C, arrow 1). (D–F): J774 cells were incubated with DNA-Alexa 488 for 24 hours and the cells immunostained for LAMP I (red, lysosomal marker-E). Plasmid DNA did not colocalize with LAMP I (F, arrow 2).
Figure 5
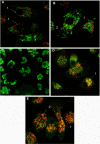
Figure 5. Visualization of the intracellular trafficking of plasmid DNA.
Confocal images of spleen-derived dendritic cells (SDCs) incubated with DNA-Alexa 488 (green) for 1 hour (A–B). LysoTracker Red was used as marker for late endosomes and lysosomes. After the uptake the majority of the vesicles with plasmideal DNA were not colocalized with LysoTracker Red (A and B, -red, arrows 1). However, some colocalization was detected (B, yellow, arrows 2). (C–E): Visualization of the inhibition of the acidification of late endosomes/lysosomes by the plasmid DNA. Confocal images of spleen-derived dendritic cells (SDCs) incubated with DNA-Alexa 594 (red) and DQ Ovalbumin simultaneously (C: 1 min; D: 24 h and E: 72 h). DQ Ovalbumin is a self-quenched conjugate of ovalbumin that exhibits bright green fluorescence upon proteolytic degradation. It's was used as tool to determined inhibition of the acidification of late endosomes/lysosomes by the plasmid DNA. At 1 minute DQ Ovalbumin was degraded (green color) and the plasmid not was captured yet (not red color). After 24 h several colocalization points was observed (D-arrow 1) and after 72 h only some colocalization was detected (E-arrow 1), suggesting that DNA (red color, E-arrow 2) inhibited the acidification of the vesicles, prejudicing the OVA proteolytic degradation.
Figure 6
Figure 6. DNA treatment impairs KLH antigen presentation.
Peritoneal macrophages were incubated with DNA (20 µg) 72 h, 48 h, 24 h or 0 h prior to the treatment with KLH (100 µg). After KLH treatment (24 h), the peritoneal macrophages were fixed and CD4 T cells specific for KLH were added to the culture. Proliferation was measured after 72 h. Concanavalin A (40 µg/ml) was used as positive control. * p<0.05 (OneWayANOVA).
Figure 7
Figure 7. Uptake of DNA was independent of TLR9 receptor and recruitment of Myd88 was not affected.
TLR9 KO cells were incubated with DNA-Alexa 594 (red-A and B) for 1 hour. The DNA was internalized by these cells. Raw cells (C–E) expressing GFP-tagged MyD88, were incubated with DNA-Alexa 594 (red-D) for 1 hour. Colocalization of GFP-Myd88 and fluorescent DNA was observed in vesicles (Arrows, yellow fluorescence–E).

Similar articles

Cited by

References

    1. Gurunathan S, Klinman DM, Seder, RA DNA vaccines: immunology, application, and optimization. Annu Rev Immunol. 2000;18:927–974. - PubMed
    1. Benvenisty N, Reshef L. Direct introduction of genes into rats and expression of the genes. Proc Natl Acad Sci USA. 1986;83:9551–9555. - PMC - PubMed
    1. Wolff JA, Malone RW, Williams P, Chong W, Acsadi G, et al. Direct gene transfer into mouse muscle in vivo. Science. 1990;247:1465–1468. - PubMed
    1. Acsadi G, Jiao SS, Jani A, Duke D, Williams P, et al. Direct gene transfer and expression into rat heart in vivo. New Biol. 1991;3:71–81. - PubMed
    1. Hengge UR, Walker PS, Vogel JC. Expression of naked DNA in human, pig, and mouse skin. J Clin Invest. 1996;97:2911–2916. - PMC - PubMed

Publication types

MeSH terms