

Identification of upper respiratory tract pathogens using electrochemical detection on an oligonucleotide microarray
- PMID: 17895966
- PMCID: PMC1976596
- DOI: 10.1371/journal.pone.0000924
Identification of upper respiratory tract pathogens using electrochemical detection on an oligonucleotide microarray
Abstract
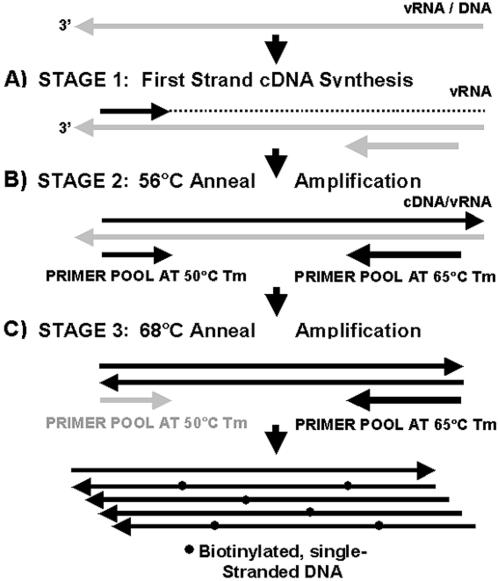
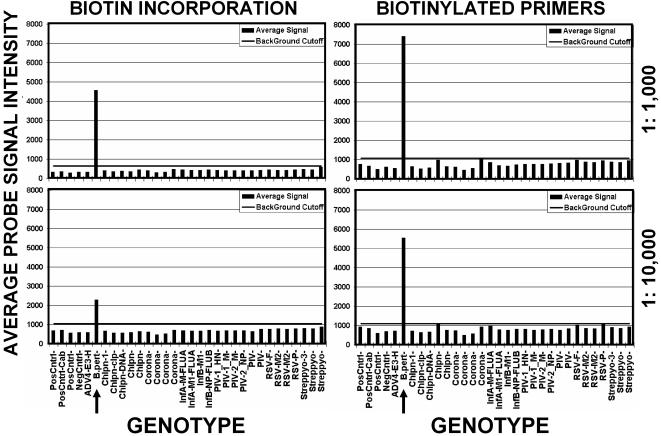
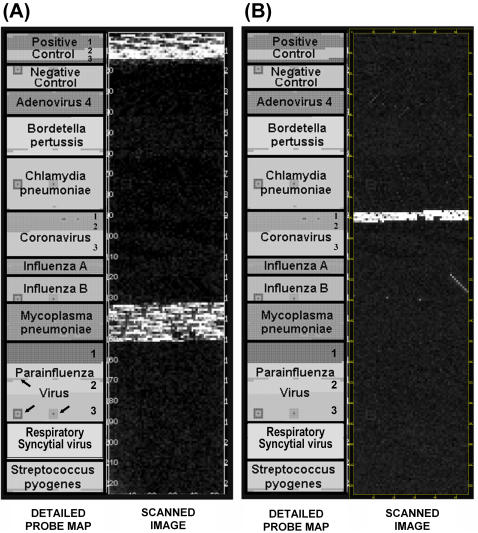
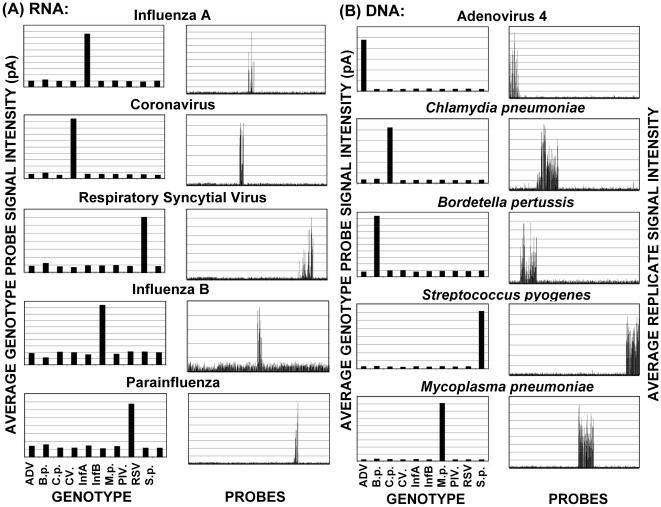
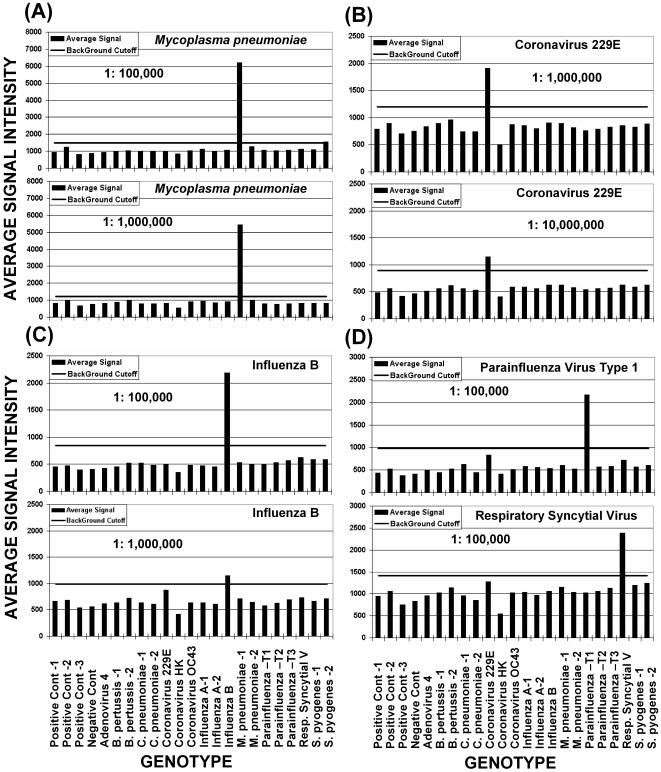
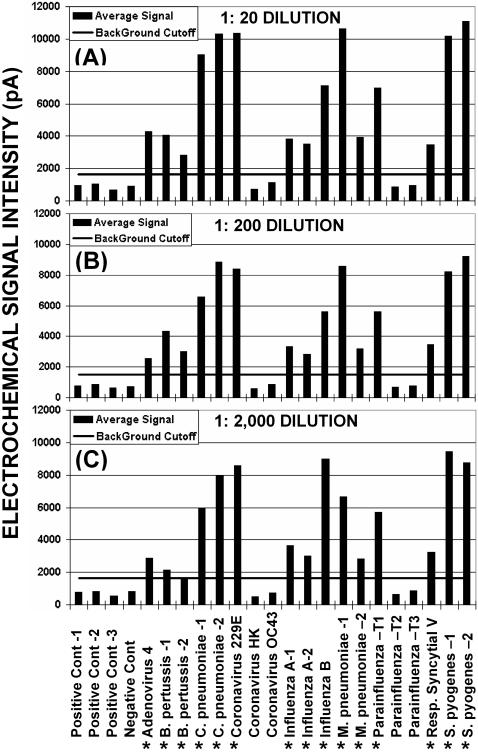
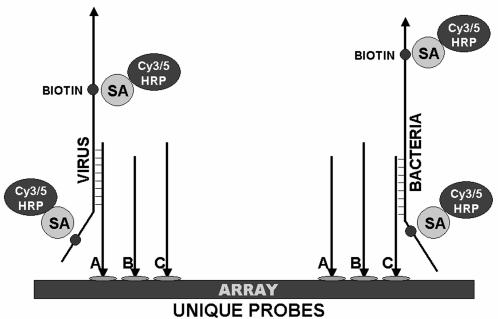
Bacterial and viral upper respiratory infections (URI) produce highly variable clinical symptoms that cannot be used to identify the etiologic agent. Proper treatment, however, depends on correct identification of the pathogen involved as antibiotics provide little or no benefit with viral infections. Here we describe a rapid and sensitive genotyping assay and microarray for URI identification using standard amplification and hybridization techniques, with electrochemical detection (ECD) on a semiconductor-based oligonucleotide microarray. The assay was developed to detect four bacterial pathogens (Bordetella pertussis, Streptococcus pyogenes, Chlamydia pneumoniae and Mycoplasma pneumoniae) and 9 viral pathogens (adenovirus 4, coronavirus OC43, 229E and HK, influenza A and B, parainfluenza types 1, 2, and 3 and respiratory syncytial virus. This new platform forms the basis for a fully automated diagnostics system that is very flexible and can be customized to suit different or additional pathogens. Multiple probes on a flexible platform allow one to test probes empirically and then select highly reactive probes for further iterative evaluation. Because ECD uses an enzymatic reaction to create electrical signals that can be read directly from the array, there is no need for image analysis or for expensive and delicate optical scanning equipment. We show assay sensitivity and specificity that are excellent for a multiplexed format.
Conflict of interest statement
Figures

Similar articles
-
Development of three multiplex RT-PCR assays for the detection of 12 respiratory RNA viruses.J Virol Methods. 2005 Jun;126(1-2):53-63. doi: 10.1016/j.jviromet.2005.01.020. J Virol Methods. 2005. PMID: 15847919 Free PMC article.
-
Simultaneous detection of fourteen respiratory viruses in clinical specimens by two multiplex reverse transcription nested-PCR assays.J Med Virol. 2004 Mar;72(3):484-95. doi: 10.1002/jmv.20008. J Med Virol. 2004. PMID: 14748074 Free PMC article.
-
Evaluation of the Prodesse Hexaplex multiplex PCR assay for direct detection of seven respiratory viruses in clinical specimens.Am J Clin Pathol. 2001 Aug;116(2):218-24. doi: 10.1309/F1R7-XD6T-RN09-1U6L. Am J Clin Pathol. 2001. PMID: 11488068
-
[Molecular biology in the diagnosis of acute bacterial infection of the respiratory tract].Enferm Infecc Microbiol Clin. 2008 Jul;26 Suppl 9:26-32. doi: 10.1016/s0213-005x(08)76538-8. Enferm Infecc Microbiol Clin. 2008. PMID: 19195444 Review. Spanish.
-
[Resequencing microarrays: a rapid tool for better identification and understanding of viral and bacterial emergence].Bull Acad Natl Med. 2013 Dec;197(9):1669-82. Bull Acad Natl Med. 2013. PMID: 26137813 Review. French.
Cited by
-
Applications of microarrays in pathogen detection and biodefence.Trends Biotechnol. 2009 Jan;27(1):53-61. doi: 10.1016/j.tibtech.2008.09.004. Epub 2008 Nov 12. Trends Biotechnol. 2009. PMID: 19008003 Free PMC article. Review.
-
Antibody Modified Gold Electrode as an Impedimetric Biosensor for the Detection of Streptococcus pyogenes.Sensors (Basel). 2020 Sep 17;20(18):5324. doi: 10.3390/s20185324. Sensors (Basel). 2020. PMID: 32957594 Free PMC article.
-
Seasonal changes in bacterial and archaeal gene expression patterns across salinity gradients in the Columbia River coastal margin.PLoS One. 2010 Oct 13;5(10):e13312. doi: 10.1371/journal.pone.0013312. PLoS One. 2010. PMID: 20967204 Free PMC article.
-
Overview of electrochemical DNA biosensors: new approaches to detect the expression of life.Sensors (Basel). 2009;9(4):3122-48. doi: 10.3390/s90403122. Epub 2009 Apr 24. Sensors (Basel). 2009. PMID: 22574066 Free PMC article.
-
Evolving gene targets and technology in influenza detection.Mol Diagn Ther. 2013 Oct;17(5):273-86. doi: 10.1007/s40291-013-0040-9. Mol Diagn Ther. 2013. PMID: 23686537 Free PMC article. Review.
References
-
- Costa LF, Yokosawa J, Mantese OC, Oliveira TFM, Silveira HL, et al. Respiratory viruses in children younger than five years old with acute respiratory disease from 2001 to 2004 in Uberlandia, MG, Brazil. Mem Inst Oswaldo Cruz. 2006;101:301–306. - PubMed
-
- Dosh SA. Predictors of antibiotic prescribing for nonspecific upper respiratory infections, acute bronchitis, and acute sinusitis. J Fam Pract. 2000;49:407–414. - PubMed
-
- Liu HH. Overuse of antimicrobial therapy for upper respiratory infections and acute bronchitis: Who, why, and what can be done? Pharmacotherapy. 1999;19:371–373. - PubMed
Publication types
MeSH terms
Substances
LinkOut - more resources
Full Text Sources
Other Literature Sources
Molecular Biology Databases
