. 2007 Sep 26;2(9):e925.
doi: 10.1371/journal.pone.0000925.

Iron storage within dopamine neurovesicles revealed by chemical nano-imaging

Affiliations

Iron storage within dopamine neurovesicles revealed by chemical nano-imaging

Richard Ortega et al. PLoS One. .

Abstract

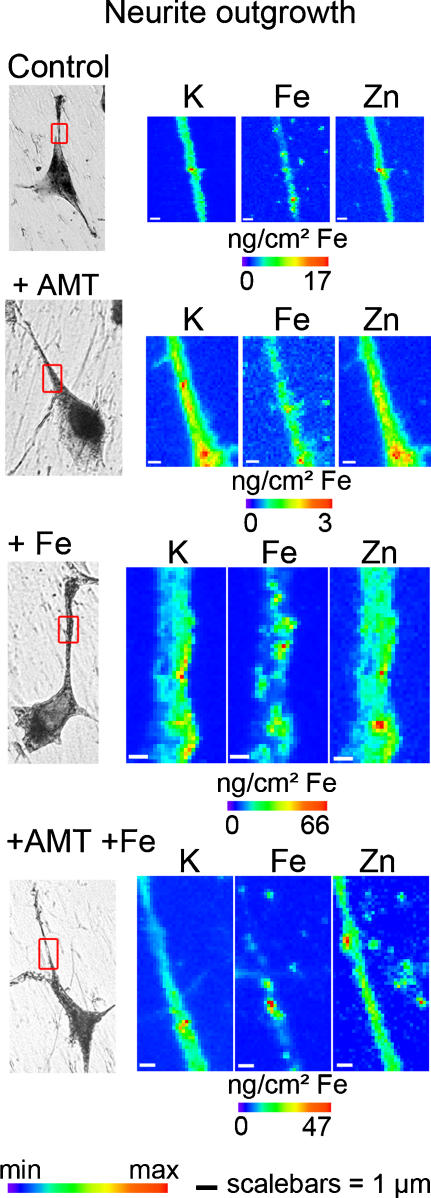
Altered homeostasis of metal ions is suspected to play a critical role in neurodegeneration. However, the lack of analytical technique with sufficient spatial resolution prevents the investigation of metals distribution in neurons. An original experimental setup was developed to perform chemical element imaging with a 90 nm spatial resolution using synchrotron-based X-ray fluorescence. This unique spatial resolution, combined to a high brightness, enables chemical element imaging in subcellular compartments. We investigated the distribution of iron in dopamine producing neurons because iron-dopamine compounds are suspected to be formed but have yet never been observed in cells. The study shows that iron accumulates into dopamine neurovesicles. In addition, the inhibition of dopamine synthesis results in a decreased vesicular storage of iron. These results indicate a new physiological role for dopamine in iron buffering within normal dopamine producing cells. This system could be at fault in Parkinson's disease which is characterized by an increased level of iron in the substantia nigra pars compacta and an impaired storage of dopamine due to the disruption of vesicular trafficking. The re-distribution of highly reactive dopamine-iron complexes outside neurovesicles would result in an enhanced death of dopaminergic neurons.


Conflict of interest statement

Competing Interests: The authors have declared that no competing interests exist.

Figures

Figure 1
Figure 1. Synchrotron X-ray chemical nano-imaging reveals iron sub-cellular distribution.
The synchrotron X-ray fluorescence nanoprobe end-station installed at ESRF was designed to provide a high flux hard X-ray beam of less than 90 nm size (FWHM, full width at half maximum). The intensity distribution in the focal plane is shown in (A); dopamine producing cells were exposed in vitro to 300 µM FeSO4 during 24 h (B). Chemical element distributions, here potassium and iron, were recorded on distinct cellular areas such as cell bodies (C), neurite outgrowths, and distal ends (D). Iron was found in 200 nm structures in the cytosol, neurite outgrowths, and distal ends, but not in the nucleus. Iron rich structures are not always resolved by the beam and clusters of larger dimension are also observed. Min-max range bar units are arbitrary. Scale bars = 1 µm.
Figure 2
Figure 2. Nano-imaging of potassium, iron, and zinc in cell bodies.
Each series of images are representative of the entire cell population for each condition (control, 1mM AMT and/or 300 µM FeSO4). The scanned area (left images, red squares) is shown on a bright field microscopy view of the freeze dried cell. Iron is located within the cytosol in vesicles of 200 nm size or more (Control). In cells exposed to iron alone Fe, and to AMT+Fe, a larger number of iron-rich structures are observed in cell bodies. In cell bodies of cells exposed to AMT alone, only a basal level of diffused iron is observed and almost no iron-rich structures. Min-max range bar units are arbitrary for potassium and zinc distributions. For iron distribution the maximum threshold values in micrograms per squared centimeter are shown for each color scale. Scale bars = 1 µm.
Figure 3
Figure 3. Nano-imaging of potassium, iron, and zinc in neurite outgrowths.
Each series of images are representative of the entire cell population for each condition (control, 1mM AMT and/or 300 µM FeSO4). The scanned area (left images, red squares) is shown on a bright field microscopy view of the freeze dried cell. Iron is located within dopamine vesicles of 200 nm size or more in control cells with a large number of Fe-dopamine structures in Fe exposed cells. Iron concentration is close to the limit of detection in neurites of AMT cells. Min-max range bar units are arbitrary for potassium and zinc distributions. For iron distribution the maximum threshold values in micrograms per squared centimeter are shown for each color scale. Scale bars = 1 µm.
Figure 4
Figure 4. Nano-imaging of potassium, iron, and zinc in distal ends.
Each series of images are representative of the entire cell population for each condition (control, 1mM AMT and/or 300 µM FeSO4). The scanned area (left images, red squares) is shown on a bright field microscopy view of the freeze dried cell. Iron is located within dopamine vesicles of 200 nm size or more (Control, and Fe conditions). Iron concentration is close to the limit of detection in distal ends of AMT, and AMT+Fe cells; only a basal level of Fe is observed. Min-max range bar units are arbitrary for potassium and zinc distributions. For iron distribution the maximum threshold values in micrograms per squared centimeter are shown for each color scale. Scale bars = 1 µm.
Figure 5
Figure 5. Iron is localized within dopamine neurovesicles.
Visible light microscopy of freeze-dried cells (A), and epifluorescence microscopy of the same freeze-dried cells (B) enable the identification of dopamine distribution, while synchrotron X-ray fluorescence nano-imaging reveals the distribution of iron (C, D). Panels C and D represent comparison of the same region imaged in a fluorescent mode to visualize dopamine and with X-ray fluorescence to localize iron. Dopamine and iron are co-located within 200 nm structures characteristic of dopamine neurovesicles as identified by epifluorescence microscopy. A large number of iron and dopamine neurovesicles are found in neurite outgrowths (C) and distal ends (D). Min-max range bar units are arbitrary. Scale bars = 1 µm.
Figure 6
Figure 6. Cellular iron and zinc concentrations (µg/g dry mass; mean±SD; n = 6), obtained by PIXE quantitative micro-analysis.
The data are the mean of six independent analyses performed on areas containing several hundred of cells for each condition of culture. The inhibition of dopamine synthesis (AMT, and AMT+Fe) results in a decrease of total iron concentration, while zinc concentration is not changed, suggesting a specific role of dopamine in iron homeostasis.
Figure 7
Figure 7. Sub-cellular iron quantitative distribution in cell bodies, neurite outgrowths, and distal ends
(ng/cm2 ; mean±SD; n = 4 to 6), obtained through synchrotron X-ray fluorescence nanoprobe analysis shows that iron content is decreased particularly in neurite outgrowths and distal ends after AMT exposure (AMT and AMT+Fe), indicating that the decrease of total iron concentration is related to the reduction of the number of iron-dopamine neurovesicles.

References

    1. Bossy-Wetzel E, Schwarzenbacher R, Lipton SA. Molecular pathways to neurodegeneration. Nature Med. 2004;10:S2–S9. - PubMed
    1. Gaeta A, Hider RC. The crucial role of metal ions in neurodegeneration: the basis for a promising therapeutic strategy. Br J Pharmacol. 2005;146:1041–1059. - PMC - PubMed
    1. Ke Y, Ming Qian Z. Iron misregulation in the brain: a primary cause of neurodegenerative disorders. Lancet Neurol. 2003;2:246–53. - PubMed
    1. Zecca L, Youdim MB, Riederer P, Connor JR, Crichton RR. Iron, brain ageing and neurodegenerative disorders. Nature Rev Neurosci. 2004;5:863–873. - PubMed
    1. Dexter DT, Wells FR, Agid F, Agid Y, Lees AJ, et al. Increased nigral iron content in post-mortem parkinsonian brain. Lancet. 1987;2:1219–1220. - PubMed

Publication types