

Lactate, fructose and glucose oxidation profiles in sports drinks and the effect on exercise performance
- PMID: 17895968
- PMCID: PMC1976551
- DOI: 10.1371/journal.pone.0000927
Lactate, fructose and glucose oxidation profiles in sports drinks and the effect on exercise performance
Abstract
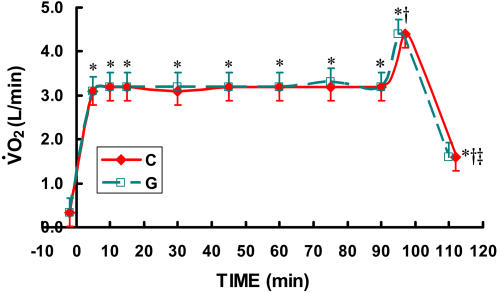
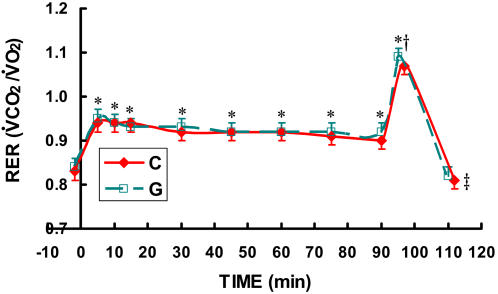
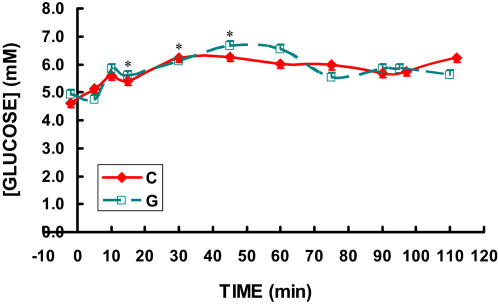
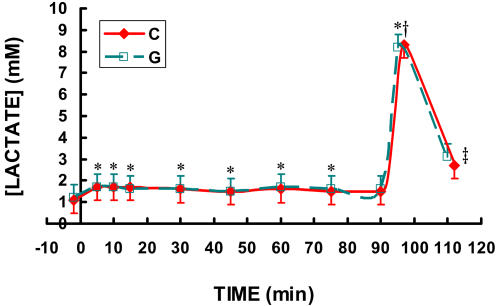
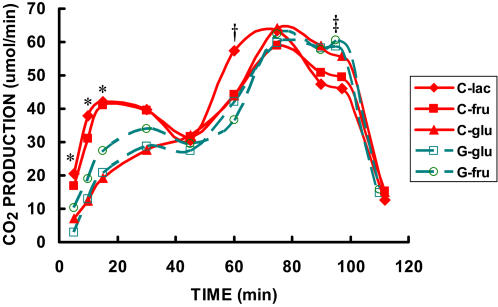
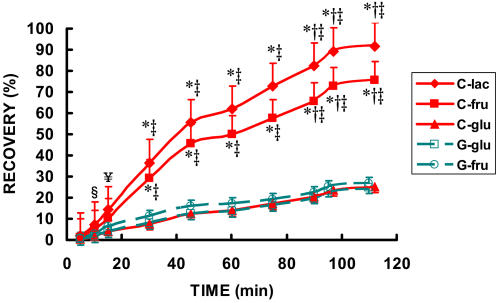
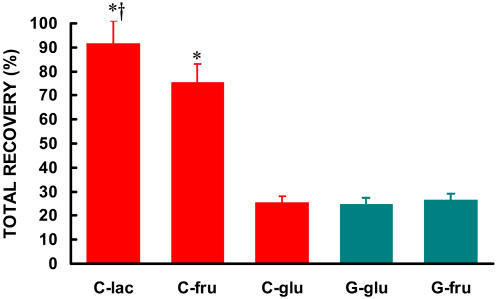
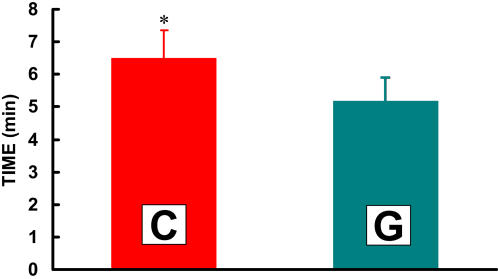
Exogenous carbohydrate oxidation was assessed in 6 male Category 1 and 2 cyclists who consumed CytoMax (C) or a leading sports drink (G) before and during continuous exercise (CE). C contained lactate-polymer, fructose, glucose and glucose polymer, while G contained fructose and glucose. Peak power output and VO2 on a cycle ergometer were 408+/-13 W and 67.4+/-3.2 mlO2 x kg(-1) x min(-1). Subjects performed 3 bouts of CE with C, and 2 with G at 62% VO2peak for 90 min, followed by high intensity (HI) exercise (86% VO(2)peak) to volitional fatigue. Subjects consumed 250 ml fluid immediately before (-2 min) and every 15 min of cycling. Drinks at -2 and 45 min contained 100 mg of [U-(13)C]-lactate, -glucose or -fructose. Blood, pulmonary gas samples and 13CO2 excretion were taken prior to fluid ingestion and at 5,10,15,30,45,60,75, and 90 min of CE, at the end of HI, and 15 min of recovery. HI after CE was 25% longer with C than G (6.5+/-0.8 vs. 5.2+/-1.0 min, P<0.05). 13CO2 from the -2 min lactate tracer was significantly elevated above rest at 5 min of exercise, and peaked at 15 min. 13CO2 from the -2 min glucose tracer peaked at 45 min for C and G. 13CO2 increased rapidly from the 45 min lactate dose, and by 60 min of exercise was 33% greater than glucose in C or G, and 36% greater than fructose in G. 13CO2 production following tracer fructose ingestion was greater than glucose in the first 45 minutes in C and G. Cumulative recoveries of tracer during exercise were: 92%+/-5.3% for lactate in C and 25+/-4.0% for glucose in C or G. Recoveries for fructose in C and G were 75+/-5.9% and 26+/-6.6%, respectively. Lactate was used more rapidly and to a greater extent than fructose or glucose. CytoMax significantly enhanced HI.
Conflict of interest statement
Figures
Similar articles
-
Oxidation of combined ingestion of glucose and fructose during exercise.J Appl Physiol (1985). 2004 Apr;96(4):1277-84. doi: 10.1152/japplphysiol.00974.2003. Epub 2003 Dec 2. J Appl Physiol (1985). 2004. PMID: 14657042
-
Substrate utilization during exercise with glucose and glucose plus fructose ingestion in boys ages 10--14 yr.J Appl Physiol (1985). 2001 Mar;90(3):903-11. doi: 10.1152/jappl.2001.90.3.903. J Appl Physiol (1985). 2001. PMID: 11181599
-
Exogenous carbohydrate oxidation rates are elevated after combined ingestion of glucose and fructose during exercise in the heat.J Appl Physiol (1985). 2006 Mar;100(3):807-16. doi: 10.1152/japplphysiol.00322.2005. Epub 2005 Nov 10. J Appl Physiol (1985). 2006. PMID: 16282436 Clinical Trial.
-
Fructose-Glucose Composite Carbohydrates and Endurance Performance: Critical Review and Future Perspectives.Sports Med. 2015 Nov;45(11):1561-76. doi: 10.1007/s40279-015-0381-0. Sports Med. 2015. PMID: 26373645 Review.
-
Fructose Metabolism from a Functional Perspective: Implications for Athletes.Sports Med. 2017 Mar;47(Suppl 1):23-32. doi: 10.1007/s40279-017-0692-4. Sports Med. 2017. PMID: 28332117 Review.
Cited by
-
Effects of Oral Lactate Supplementation on Acid-Base Balance and Prolonged High-Intensity Interval Cycling Performance.J Funct Morphol Kinesiol. 2024 Aug 20;9(3):139. doi: 10.3390/jfmk9030139. J Funct Morphol Kinesiol. 2024. PMID: 39189224 Free PMC article.
-
Exogenous lactate supply affects lactate kinetics of rainbow trout, not swimming performance.Am J Physiol Regul Integr Comp Physiol. 2014 Oct 15;307(8):R1018-24. doi: 10.1152/ajpregu.00200.2014. Epub 2014 Aug 13. Am J Physiol Regul Integr Comp Physiol. 2014. PMID: 25121611 Free PMC article.
-
Lactate Activates AMPK Remodeling of the Cellular Metabolic Profile and Promotes the Proliferation and Differentiation of C2C12 Myoblasts.Int J Mol Sci. 2022 Nov 13;23(22):13996. doi: 10.3390/ijms232213996. Int J Mol Sci. 2022. PMID: 36430479 Free PMC article.
-
Re-Evaluating the Oxidative Phenotype: Can Endurance Exercise Save the Western World?Antioxidants (Basel). 2021 Apr 15;10(4):609. doi: 10.3390/antiox10040609. Antioxidants (Basel). 2021. PMID: 33921022 Free PMC article. Review.
-
Oral Lactate Administration Additively Enhances Endurance Training-Induced Increase in Cytochrome C Oxidase Activity in Mouse Soleus Muscle.Nutrients. 2020 Mar 14;12(3):770. doi: 10.3390/nu12030770. Nutrients. 2020. PMID: 32183387 Free PMC article.
References
-
- Jeukendrup AE. Carbohydrate intake during exercise and performance. Nutrition. 2004;20:669–677. - PubMed
-
- Mitchell JB, Costill DL, Houmard JA, Fink WJ, Pascoe DD, Pearson DR. Influence of carbohydrate dosage on exercise performance and glycogen metabolism. J Appl Physiol. 1989;67:1843–1849. - PubMed
-
- Murray R. Rehydration strategies–balancing substrate, fluid, and electrolyte provision. Int J Sports Med. 1998;2:133–135. - PubMed
-
- Brooks GA. Mammalian fuel utilization during sustained exercise. Comp Biochem Physiol. 1998;120:89–107. - PubMed
-
- Fahey TD, Larsen JD, Brooks GA, Colvin W, Henderson S, et al. The effects of ingesting polylactate or glucose polymer drinks during prolonged exercise. Int J Sports Nutr. 1991;1:249–256. - PubMed
Publication types
MeSH terms
Substances
LinkOut - more resources
Full Text Sources
Other Literature Sources
Medical
Miscellaneous
