

Causal inference in multisensory perception
- PMID: 17895984
- PMCID: PMC1978520
- DOI: 10.1371/journal.pone.0000943
Causal inference in multisensory perception
Abstract
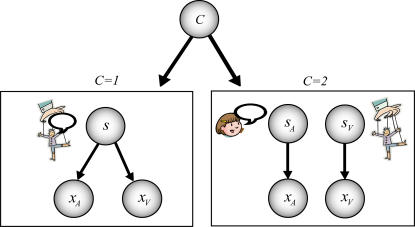
Perceptual events derive their significance to an animal from their meaning about the world, that is from the information they carry about their causes. The brain should thus be able to efficiently infer the causes underlying our sensory events. Here we use multisensory cue combination to study causal inference in perception. We formulate an ideal-observer model that infers whether two sensory cues originate from the same location and that also estimates their location(s). This model accurately predicts the nonlinear integration of cues by human subjects in two auditory-visual localization tasks. The results show that indeed humans can efficiently infer the causal structure as well as the location of causes. By combining insights from the study of causal inference with the ideal-observer approach to sensory cue combination, we show that the capacity to infer causal structure is not limited to conscious, high-level cognition; it is also performed continually and effortlessly in perception.
Conflict of interest statement
Figures
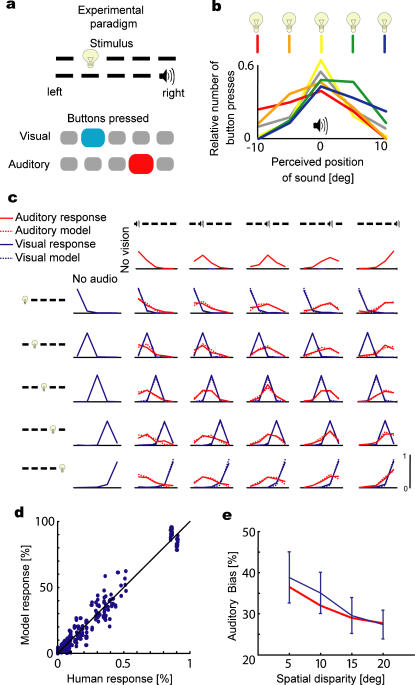
 , i.e. the influence of deviations of the visual position on the perceived auditory position is shown as a function of the spatial disparity (solid line) along with the model prediction (dashed line).
References
-
- Hatfield GC. Cambridge, Mass: MIT Press; 1990. The natural and the normative theories of spatial perception from Kant to Helmholtz.
-
- Thurlow WR, Jack CE. Certain determinants of the “ventriloquism effect”. Percept Mot Skills. 1973;36:1171–1184. - PubMed
-
- Warren DH, Welch RB, McCarthy TJ. The role of visual-auditory “compellingness” in the ventriloquism effect: implications for transitivity among the spatial senses. Percept Psychophys. 1981;30:557–564. - PubMed
-
- Jacobs RA. Optimal integration of texture and motion cues to depth. Vision Res. 1999;39:3621–3629. - PubMed
-
- van Beers RJ, Sittig AC, Gon JJ. Integration of proprioceptive and visual position-information: An experimentally supported model. J Neurophysiol. 1999;81:1355–1364. - PubMed
